Revision notes
System Modelling

Contents
- Data flow diagrams vs information flow diagrams
- System diagrams
- Using system diagrams
- System diagram conventions
- Interpreting system diagrams
- Flowcharts
- Flowchart symbols
- Following a flowchart
- Flowchart rules and common errors
- Drawing and describing flowcharts
- Advantages and limitations of flowcharts
- Data flow diagrams
- Data flow diagram components
- Data flow diagram rules
- Reading and describing data flow diagrams
- Data flow diagram benefits and limitations
A data flow diagram (DFD) models how data moves through a system. It focuses on the processes that change data and the data stores where data is kept, together with the flows between them. An information flow diagram takes a different view: it focuses on the information used at points in a system, such as what someone at a desk or workstation needs to see and use to do their job.
These are different forms of notation, so they should not be confused. A data flow diagram answers questions such as “Where does this data go, what changes it and where is it stored?” An information flow diagram answers questions such as “What information is available or needed at this point, and how is it used?”
| Feature | Data flow diagram | Information flow diagram |
|---|---|---|
| Focuses on | Processes and data stores that data passes through | Information used at points in a system |
| Shows | The movement of data between processes, stores and outside parties | The information needed or available at each point, and how it is used |
| Typical question | Where is a repair booking stored before a mechanic sees it? | What does reception need to know before booking a repair? |
For example, in a bike repair shop, a data flow diagram could follow a booking from the customer details entering a booking process, through a repairs store, to the process that prepares the job sheet. An information flow diagram for the same shop could show that reception needs the customer’s name, contact number and bike fault to make a booking, while the mechanic needs the fault description and parts needed to carry out the repair.
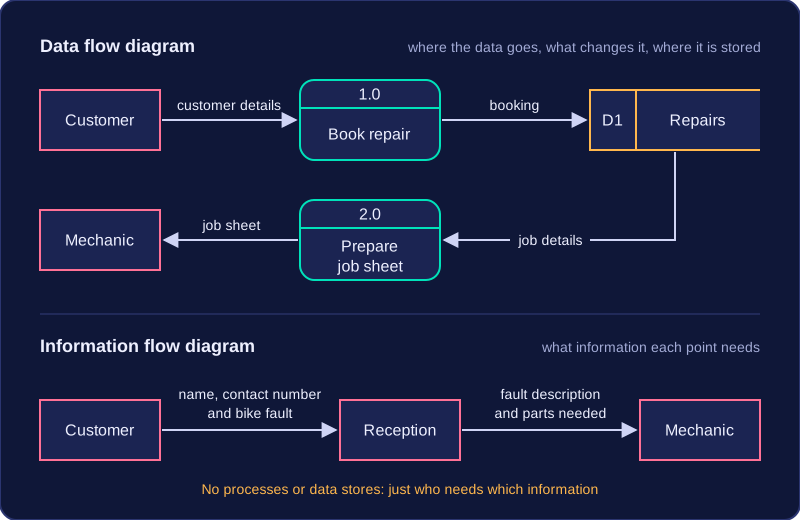
Do not treat the two as the same diagram with different labels: a data flow diagram tracks data through processes and storage, while an information flow diagram shows how information is used at particular points.
A system diagram is a form of notation: a way of writing down and representing a system so that you can see how it works. It is not a flowchart. A flowchart shows the order in which steps happen, one after another. A system diagram instead shows the parts that make up a system and how they are joined together.
What a system diagram shows
A system diagram names the components (the parts) of a system. For a school library, the components might be a librarian's desktop computer, a barcode scanner, a library server holding the book catalogue, and a printer for overdue slips. It also shows the physical resources the system needs, such as the computers, scanners, cables and other hardware that make it work.
Alongside the parts, a system diagram shows the processes carried out inside the system. In the library these could be scanning a book to lend it, checking whether a title is already on loan, and printing a reminder letter. A process is something the system does; a component is something the system has.
Connections and people
Components are joined with lines and arrows. A line shows that two parts are linked, and an arrow shows the direction that information or an action passes between them. An arrow from the scanner to the catalogue server shows that the scanned barcode is sent that way. Without the arrows you would know the parts exist but not which one feeds which.
A system diagram also shows how users interact with the computing resources. The librarian logging in at the desktop computer, a pupil checking a book out at a self-service kiosk and the library manager reading a stock report are all people inside the system, and each is drawn as a part with a connection to the hardware or process they use.
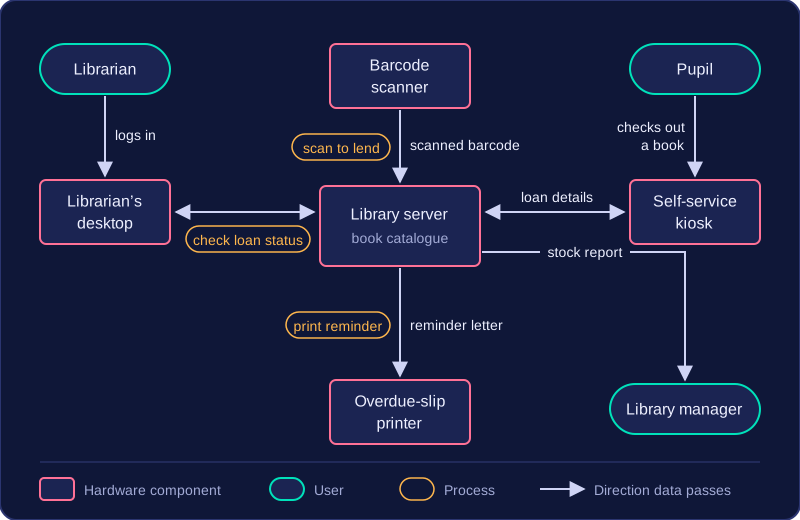
Put together, this captures a whole physical system and its components, giving a picture of the entire arrangement rather than a close-up of one device. That makes it a useful way to explain a system to someone who has never seen it, because they can follow each part, each process and each connection in one place.
A system diagram is a diagram used to explain a system to someone else. It gives people a shared picture they can look at while someone talks them through how the system works. Instead of each person imagining something different, everyone starts from the same view.
Organisations use system diagrams because a system often involves more than one person or team. Staff can see how their jobs fit into the whole arrangement, managers can check their understanding before making decisions, and clients or new employees can be shown how something works without needing to know every technical detail. This is especially useful when a system is large or when people from different areas need to understand how their part fits with the rest. A diagram can be used in a meeting, a training session or a handover, and the person explaining can point to the parts being discussed.
Computer technicians often use system diagrams to explain technology and interfaces. For example, a technician helping a youth club set up its new room might use one to show how a laptop, a card reader, a printer and the club's Wi-Fi fit together, so the volunteers can see what connects to what. A technician might also explain an interface by showing where it sits between a user and a store of information, such as a gym's check-in screen sitting between a member and the membership records.
A good system diagram should communicate what a system does and how its parts work together. Its job is not to look impressive or to include every tiny detail. It should be clear enough for its audience to follow, so someone else can understand the parts, the processes and the connections, and how they combine to make the system operate. If a diagram is confusing, it has failed at the job it was made for.
A system diagram is a form of notation that represents the parts, processes and connections in a system. It has no fixed list of components: what appears depends entirely on the system you are describing.
No fixed parts
One diagram might need only a few devices, such as two classroom tablets, a teacher's laptop and a printer. Another might need a booking webpage, a card payment service, a calendar database, a caretaker and the people hiring a village hall. Neither list is more correct than the other. The diagram is built around the system in front of you, so diagrams of different systems can look very different. Two people may even represent the same system in different ways.
No set method
Unlike a flowchart, which uses set shapes and arrows to show the order of steps, or a data flow diagram, which has rules for its symbols and connections, a system diagram has no prescribed construction method. You arrange the parts in a way that makes sense for the system and the audience. That makes system diagrams flexible, but it also means a reader cannot decode one from symbols alone.
Labels and descriptions
Because there are no compulsory symbols, labels and short descriptions are sometimes added. A label might name a part, such as calendar database, or explain a process, such as checks whether a hall is free. A description beside a line might say booking details to explain the connection. These labels and descriptions help the reader understand the diagram, but they are not a required set of symbols. The reader must use the labels and their own knowledge of the system to work out what it shows.
Interpreting a system diagram means working out what it shows: you identify its components (the parts), its processes (the jobs carried out) and its connections (the lines and arrows between them), then explain how they work together. The labels and the arrangement of the parts help you work out what each element does, even in an unfamiliar organisation.
Finding the parts and processes
Start by listing every component you can find, such as a device, a person or a store of data, and say what each is for. Then do the same for the processes, such as a check or a payment, and for what a person does with a computing resource.
For example, a bike-hire shop's system might include a counter terminal, a hire database, a tracker on each bike, a member of staff and a customer. The processes are recording a hire, taking a payment and updating a bike's location, while staff enter hires on the terminal and customers pay.
Following the connections
Every line and arrow is a link, and an arrow shows which way information or actions pass. Ask yourself what feeds into what, and which parts depend on each other. In the bike-hire example, an arrow from the tracker to the database shows location updates travel that way, so the database depends on the tracker.
Explaining the whole system
Join the parts, processes and connections into a short explanation: the staff member records a hire on the counter terminal, which updates the hire database, and the tracker sends the bike's location to that database, so staff can see where every bike is. That shows what depends on what, and where people interact with computing resources.
The same steps work in any context, including an organisation you have never come across.
Questions about system diagrams are text based, so a diagram is described in words and you will not be asked to draw one. Answer by naming the parts, processes and connections and explaining what they show about how the system works.
A flowchart is a form of notation that explains a system or process by showing the sequence of actions carried out as data enters, moves through and leaves it. Each step is written inside a shape and joined to the next by an arrow, so a reader can follow the whole process from beginning to end.
The steps sit in a fixed order, so a flowchart records the order in which tasks are completed. A written description can cover the same process, but the reader has to work out the order for themselves. A flowchart makes that order visible, which is why organisations use it as notation to explain how a system or process works.
The parts every flowchart sets out
| Part | What it shows |
|---|---|
| Start | The defined beginning of the process |
| Input | Data entering the system |
| Process | An action or calculation carried out on the data |
| Decision | A point where the flow splits into two possible paths, depending on the answer |
| Output | Data leaving the system, such as a price shown on a screen |
| End | The defined finish, where the process stops |
A worked example
A leisure centre hires out lockers. Its flowchart starts, then takes in the number of hours a customer wants. A process works out the hourly cost by multiplying the hours by £1.50. A decision then asks a yes/no question: is the number of hours more than four? The Yes path uses the day rate of £6 instead, while the No path keeps the hourly cost. Either way the flow reaches an output, which shows the amount to pay, and then the end.
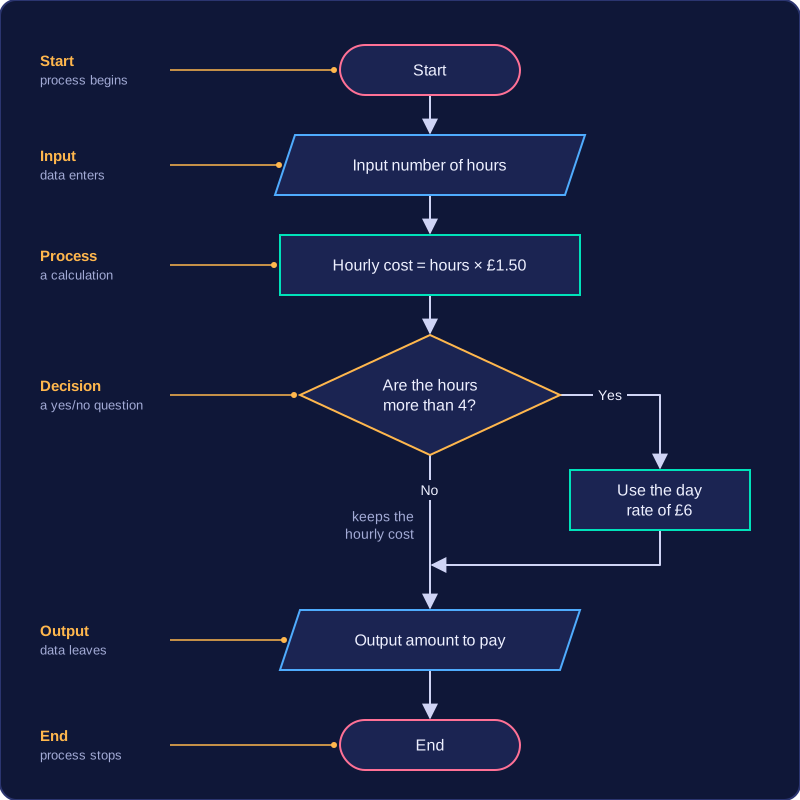
Here one set of data enters as a number of hours, moves through a calculation and a decision, and leaves as a price, with a clear start and end marking where the process begins and finishes.
Flowcharts use standard symbols so that anyone reading one can tell what each step does before they read the words written inside it. Four shapes cover almost everything you need.
| Shape | Name | What it shows | Example of the words inside |
|---|---|---|---|
| Oval | Terminator | Where the process starts or ends | Start / End |
| Parallelogram | Input/output | Data entering or leaving the system | Input the swimmer's age / Output the price |
| Rectangle | Process | An action or check the system carries out on the data | Work out the change owed |
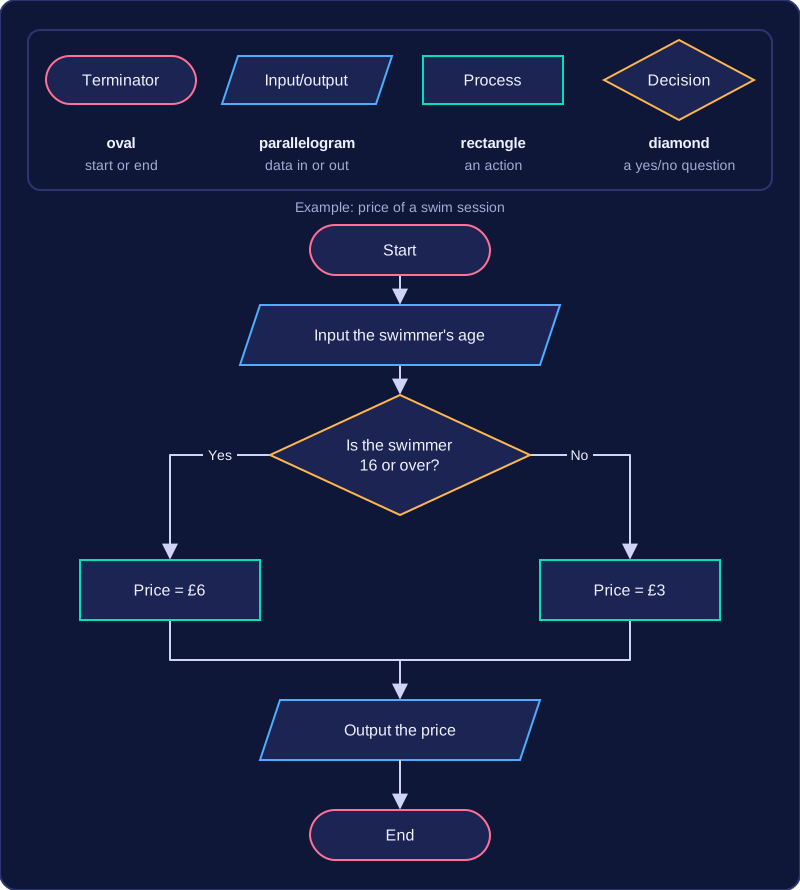
| Diamond | Decision | A question with a yes or no answer, based on a condition | Is the swimmer 16 or over? |
Input and output share one shape, because the same symbol simply means data crossing the edge of the system — in one direction or the other. Some mark schemes call that symbol a rhombus, so don't be confused if you meet the other name.
Decisions split the flow
A decision is the only symbol with two ways out. The condition inside it is written as a question, and the two exits are labelled Yes and No. Yes means the condition is true; No means it is false. The answer a particular piece of data gives decides which path the flow follows next, so leaving an exit unlabelled makes the flowchart impossible to follow.
A short example
A leisure centre charges for a swim session by age. The flowchart opens with a Start terminator, then an input of the swimmer's age, then a decision asking whether the swimmer is 16 or over. The Yes exit leads to a rectangle that sets the price at £6; the No exit leads to a rectangle that sets it at £3. Both rectangles then feed into a single output that shows the price, and one End terminator finishes the flow. Notice that the age is data coming in, the pricing is an action, and only the diamond asks a question.
Following a flowchart means starting at the Start terminator, carrying out each step in the order the arrows show, choosing the correct path at each decision, and continuing until you reach the End terminator. To find the outcome for a given input, trace that input through the process steps and decision questions until you reach the final output.
Tracing an input
Imagine a flowchart for a bike hire desk. It starts by taking the rider's age and the hire length as input. The first decision asks Is the rider under 12? If Yes, it outputs “Junior helmet needed” and ends. If No, it asks: Is the hire longer than 2 hours? If Yes, it outputs “Free water bottle”; if No, it outputs “Standard hire”. Every path then reaches End.
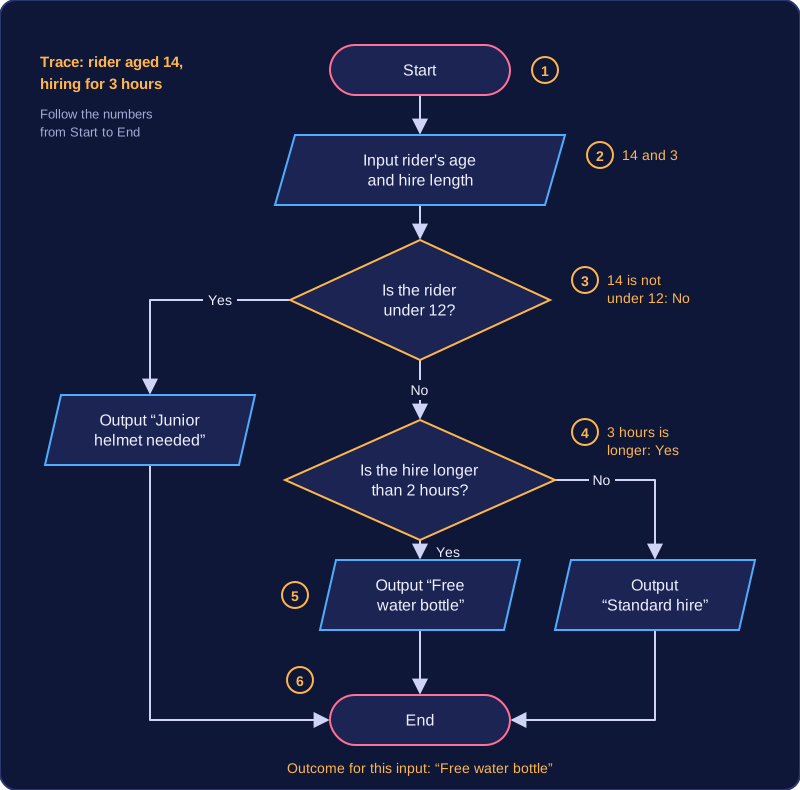
For a 14-year-old hiring for 3 hours, start at Start, input 14 and 3, answer No to the first decision, answer Yes to the second decision, and reach the output “Free water bottle” before End. The outcome is that message. For a 10-year-old, the first decision answer is Yes, so you follow that path to “Junior helmet needed” and do not visit the second decision at all: only the chosen exit from a decision is followed.
Work through the steps in sequence and keep the input value in mind, because later decisions and outputs depend on it. The final output you reach is the flowchart's outcome for that input.
A correct flowchart follows a few rules, so anyone reading it can follow the process without guessing. It has one Start terminator and one End terminator, and every route finishes at that End.
Rules for a correct flowchart
- One Start and one End: keep the End after the last output; the process is not finished until the End is reached.
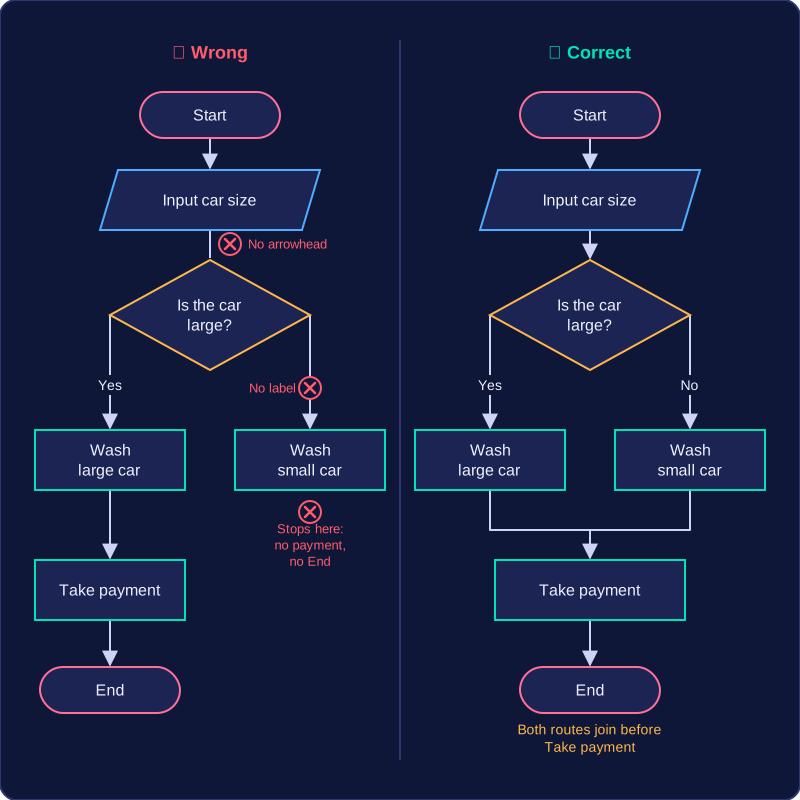
- Label and connect both decision exits: write each decision as a Yes/No question, label both exits and join each one to the next step. An exit with no label or line leaves the reader stuck.
- Finish every path at End: trace each route in turn; a route that stops at a process with nowhere to go is incomplete.
- Use arrows in one direction: lines without arrowheads, or arrows pointing both ways, make the order of steps unclear.
- Repeat a step on every path that needs it: in a car wash, if large and small cars both need "Take payment", show it on both routes or join the routes before it. Showing it on one route only makes the other skip a required step.
- Include a loop only when steps repeat: a loop is a path back to an earlier step. It suits a process where, for example, orders are taken until the customer has finished; a one-off process has no loop.
Spotting what is missing
| Rule | Error to look for |
|---|---|
| One Start and one End | No End after the final output, or two Start terminators |
| Both decision exits labelled and connected | A decision with only Yes, or a No exit with no line leaving it |
| Every path finishes at End | A route that stops at a process with nowhere to go |
| Steps on every path that needs them | Take payment shown on the large-car route only |
| Arrows show a single direction | Plain lines, or arrows pointing both ways |
| Loops only where steps repeat | A loop in a one-off process |
Checking means comparing the flowchart with the scenario: work through every path from Start to End and ask whether each step, label, connection to End and arrow direction is there. A missing step still matters.
Drawing a flowchart means turning the steps of a scenario into standard symbols joined by arrows, so another person can follow the process from start to finish. Every step must appear in the correct order, inside the correct symbol.
Steps in the right order
Work through the scenario from beginning to end. An action becomes a process rectangle; a question answered Yes or No becomes a decision diamond; data entering or leaving becomes an input/output parallelogram. Join the shapes with arrows that point one way only.
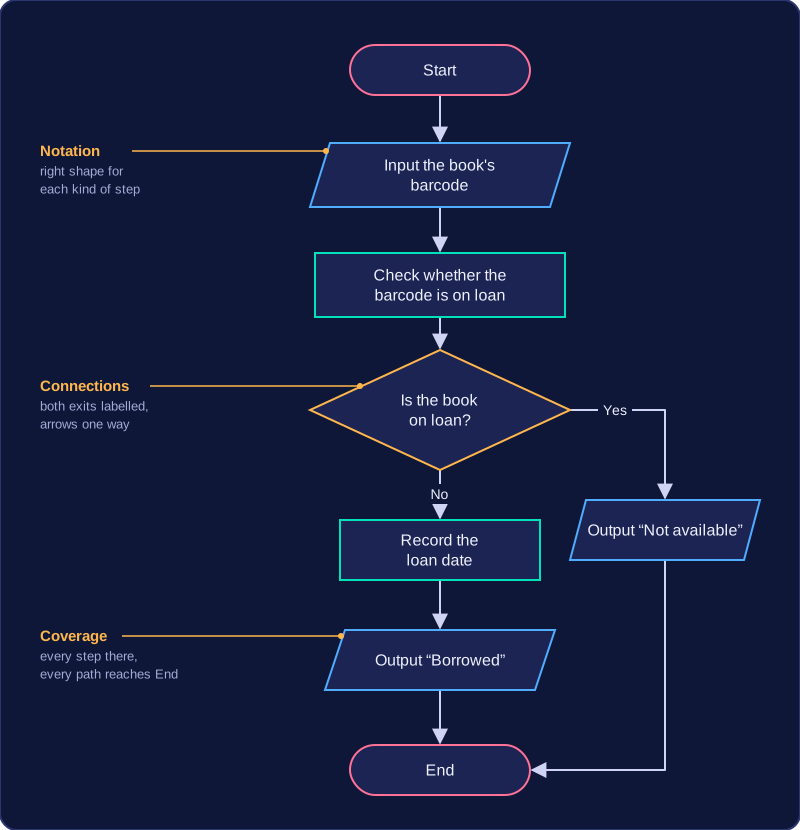
Take a school library lending a book: Start; input the book's barcode; process a check of whether that barcode is already on loan; decision "Is the book on loan?"; Yes goes to output "Not available"; No goes to process "record the loan date", then output "Borrowed"; both paths end at End. Both exits are labelled, and there is one Start and one End.
How a flowchart is marked
- Notation — the right shape and label for each kind of step.
- Connections and directions — every shape joined by an arrow, flow going forwards only, and every path reaching End.
- Coverage of the scenario — every step included, including any step needed on more than one path.
The top band needs all three mostly accurate. Your flowchart need not match a model answer: correct logic that produces the expected outcome can still earn credit. A tidy flowchart that misses a scenario step still loses coverage marks.
Describing a flowchart in words
When you describe rather than draw, include the symbols, the order of steps, what happens on each decision path, and the outcome. For the library example: "Start (oval) leads to input barcode (parallelogram), then process check loan status (rectangle), then decision 'Is the book on loan?' (diamond). Yes leads to output 'Not available' (parallelogram) and End (oval). No leads to process record the loan date, then output 'Borrowed', then End."
Flowcharts are a form of notation that organisations use to explain systems and processes. They give an overview of how work is carried out, so you can see the order of tasks at a glance instead of piecing it together from a long written description.
Advantages
Because a flowchart follows a path from start to end, it makes the sequence of work visible. That helps people see what happens first, what depends on a decision, and where one task hands over to another. A generalised overview is useful when a manager, a new employee or a customer needs to understand the main functions of a system without learning every detail.
A flowchart also helps people identify where problems occur. If a leisure centre maps how a swimming class booking is checked and confirmed, and bookings are sometimes missed, following the chart can show a missing check or a confirmation that happens too late. The problem is easier to discuss when everyone can point to the same step.
Limitations
Some processes are too complex to show clearly. A process with many exceptions and decisions can turn into a crowded chart that is harder to follow than a short written list. Adding every tiny step does not always help; beyond a point, extra detail spoils the overview.
A flowchart can also go out of date. If a system changes, the chart may need to be redrawn, and an old chart can mislead people. Finally, people must understand the purpose of the flowchart and the meaning of its symbols. Until they are familiar with it, a shape such as a diamond can confuse them rather than help.
A data flow diagram is a diagram that shows how data moves through a system. It follows data from its source, through any storage or processing, to its final destination, so it shows where data comes from, where it is stored, how it is processed and where it goes. Rather than showing every tiny step a person takes, it gives a clear map of the data itself.
What a data flow diagram shows
Each part of the system is shown by a symbol, and arrows show the direction in which data travels. For example, in a bike repair shop's booking system, a customer's repair request enters the system, is checked and recorded as a booking, and a confirmation is sent back to the customer. The diagram makes it easy to see the request, the processing, the stored booking and the confirmation as connected pieces of data.
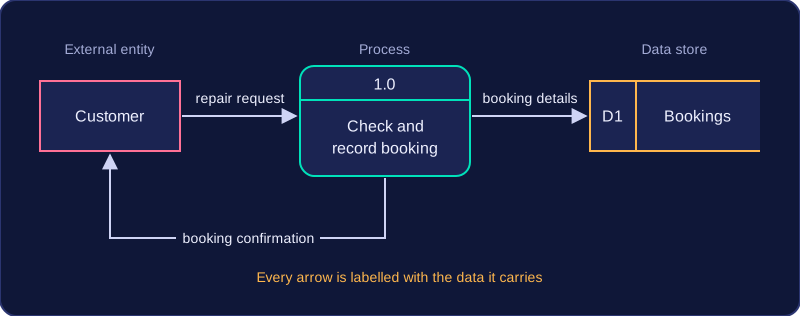
A data flow diagram is not a flowchart. A flowchart shows the order in which actions happen, often with decisions and loops. A data flow diagram shows the movement and transformation of data between parts of a system; it does not show sequence or timing.
Why organisations use them
Organisations use data flow diagrams to explain their systems, data and information to people such as new staff, managers or clients. The diagram gives a shared picture of what data enters, what happens to it and where it ends up, which is easier to discuss than a long written description.
Database developers often use data flow diagrams to explain how different data is connected. When a school library team is planning a new database, for example, they can use one to agree which details about books and borrowers are needed, where those details are stored, and which processes use them before any tables are built.
A data flow diagram is built from four components: external entities, processes, data stores and data flows. Each has its own symbol, and together the symbols show where data comes from, what happens to it, where it is kept and where it goes next.
| Component | Symbol | What it shows |
|---|---|---|
| External entity | Rectangle | A person, organisation or other system outside the system being modelled |
| Process | Rounded rectangle, or a circle in some versions | An action that transforms input data into output data |
| Data store | Open-ended rectangle, or two parallel lines | Where data is held so that it can be used again later |
| Data flow | Arrow | Data moving between components |
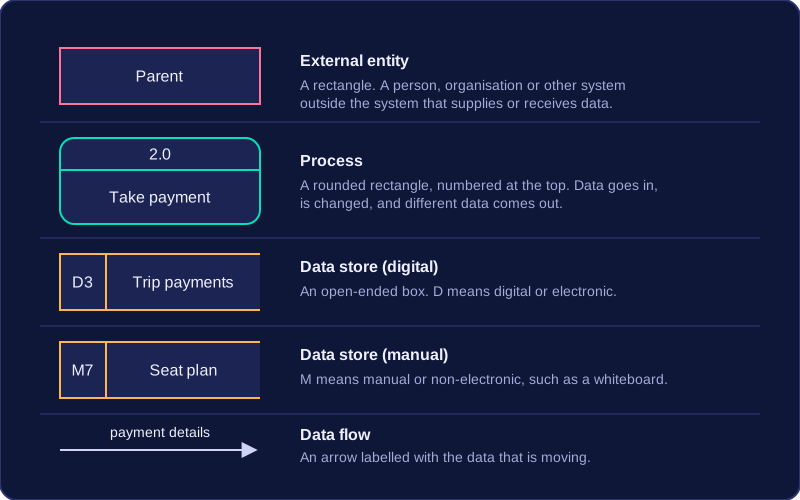
External entities sit outside the system boundary, so they are not part of the system itself. They can supply data to the system or receive data or information from it. In a system for booking school trip places, a parent and the coach company could both be external entities.
A process is where work is carried out on data: data goes in, it is changed in some way, and different data comes out. Process symbols are often numbered, such as process 2, so that each one can be referred to clearly.
A data store is where data is kept after a process has used it, so it can be used again later. Data stores are often labelled to show the form of storage: D means digital or electronic, such as D3 trip payments, while M means manual or non-electronic, such as M7, the whiteboard seat plan for each coach kept in the staff room.
Data flows are the arrows, and they are usually labelled with the data that is moving, for example “payment details” or “trip confirmation”. The label is important because the arrow alone shows only the direction, not what is travelling.
Different versions of data flow diagrams may use slightly different symbols: a process might be a rounded rectangle or a circle, while an external entity is a rectangle. The meaning of each component stays the same, so read the shape together with its label rather than relying on the shape alone.
A valid data flow diagram follows rules about how its components connect. The rules keep it consistent, so every arrow shows data being handled in a sensible way.
Where flows can start and end
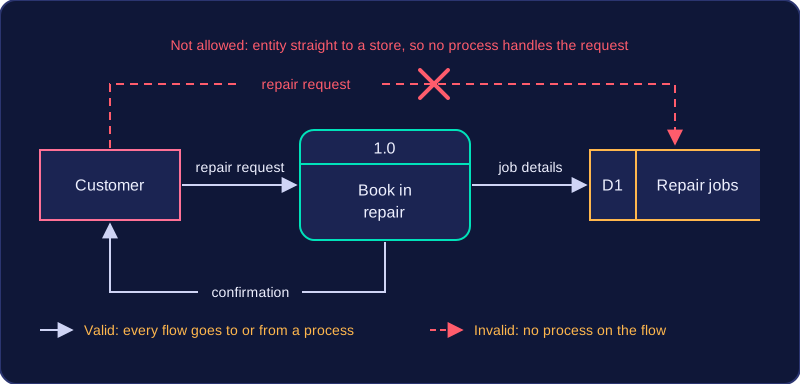
Every data flow must go to or from a process. A flow can run between two processes, from a process to a data store, from a data store into a process, from an external entity into a process, or from a process out to an external entity. It cannot join two components that never act on the data, such as two data stores or a data store and an external entity. External entities must connect to a process, not directly to another external entity, because data is only handled once a process does something with it.
For example, in a bike repair shop a Customer sends a repair request to the process Book in repair. That process saves the job in the Repair jobs store and sends a confirmation to the Customer. A flow drawn straight from Customer to Repair jobs would break the rules, because no process would handle the request.
Every process must transform data
Each process needs at least one input and at least one output. A process with only an input would take data and do nothing with it, while a process with only an output would produce data from nowhere. The inputs must be capable of producing the outputs: a process can combine, summarise or calculate from its inputs, but it cannot add data that was never supplied. A process that calculates a repair cost from parts cost and labour hours can output a total cost, but it cannot also output a customer phone number unless that was an input.
The output also cannot be identical to the input. If data passes through unchanged, nothing has been transformed, so the step is not really a process. Sorting a list of jobs by date produces a new ordered list; copying the list exactly would not be valid.
To read a data flow diagram, find every external entity (a person or system outside the system that sends or receives data), every process (an action that changes data), every data store (where data is held) and every labelled data flow (an arrow showing data moving). Work through the arrows one at a time: start at the component the arrow leaves, note the label and follow the arrowhead to the component it enters. That tells you what data is supplied, changed, saved or returned.
Turning a scenario into a full description
For a school coding club, the description could be: the external entity Student sends a sign-up request to process Check places. The process reads the current member count from the Club register data store. It compares the count with the club limit and, if a place is free, writes the updated record to the Club register and sends a place confirmation to the Student. If the club is full, it sends a club full message instead, with no store update.
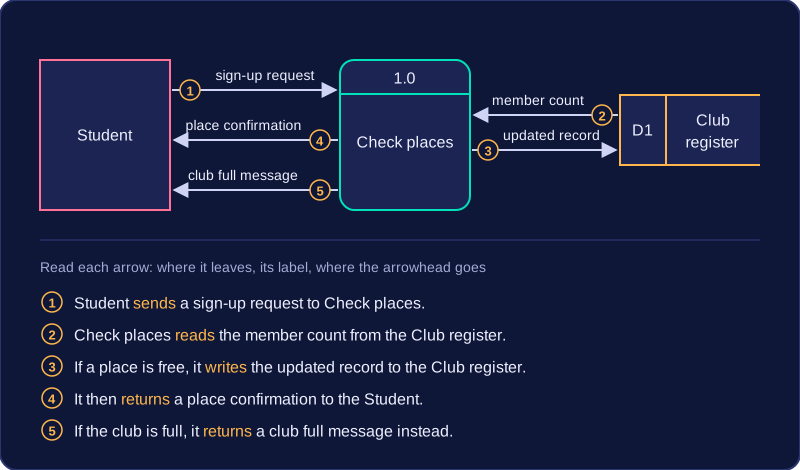
Include every input, process, store and output in the scenario, and state the direction of each flow with words such as sends, reads, writes and returns. Name the components exactly as they appear; a missing flow or an arrow described the wrong way leaves the reader unable to trace the data.
A data flow diagram is a form of notation that shows how data moves through a system. Its strengths come from what it makes easy to see, and its weaknesses come from what it leaves out.
What it helps you see
- Who and what the system interacts with. Every entity sits around the edge — the people, departments and other organisations, inside or outside the business, that send data in or receive data out — so you can see straight away that, for example, a school library system receives requests from pupils and staff and passes orders to a book supplier.
- How data moves. Following the labelled arrows shows the route a piece of data takes, from arriving, through each process, into storage and back out again.
- Where the system boundary lies. Anything drawn as an entity is outside the system and everything else is inside it, which makes the scope of a project clear to everyone who reads it.
Where it falls short
- Complexity. In a large system the flows cross each other again and again, so following one route becomes slow and mistakes are easy to miss.
- Varying symbol sets. One organisation may draw a process as a circle and another as a rounded rectangle. The meaning is unchanged, but an unfamiliar set of symbols can confuse a reader.
- No hardware or software. The notation shows what happens to data, not the devices or programs that make it happen, so it cannot be used to plan equipment purchases or to write code.
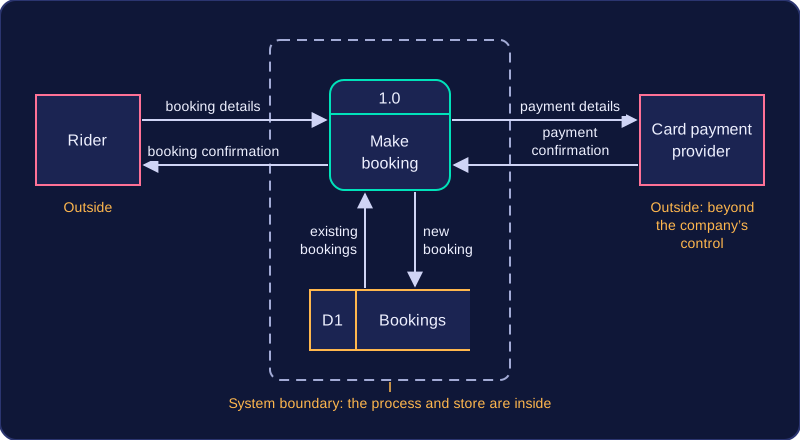
Picture a bike-hire company. A rider sends booking details to a booking process, which checks a bookings store, and a card payment provider outside the company confirms the payment; a confirmation then flows back to the rider. You can see instantly that the payment provider is beyond the company's control, which is useful. Nothing on the page tells you, though, that the booking system runs on a rented cloud server — for that you would need a different form of notation.