System Modelling
System diagrams

A system diagram is a form of notation: a way of writing down and representing a system so that you can see how it works. It is not a flowchart. A flowchart shows the order in which steps happen, one after another. A system diagram instead shows the parts that make up a system and how they are joined together.
What a system diagram shows
A system diagram names the components (the parts) of a system. For a school library, the components might be a librarian's desktop computer, a barcode scanner, a library server holding the book catalogue, and a printer for overdue slips. It also shows the physical resources the system needs, such as the computers, scanners, cables and other hardware that make it work.
Alongside the parts, a system diagram shows the processes carried out inside the system. In the library these could be scanning a book to lend it, checking whether a title is already on loan, and printing a reminder letter. A process is something the system does; a component is something the system has.
Connections and people
Components are joined with lines and arrows. A line shows that two parts are linked, and an arrow shows the direction that information or an action passes between them. An arrow from the scanner to the catalogue server shows that the scanned barcode is sent that way. Without the arrows you would know the parts exist but not which one feeds which.
A system diagram also shows how users interact with the computing resources. The librarian logging in at the desktop computer, a pupil checking a book out at a self-service kiosk and the library manager reading a stock report are all people inside the system, and each is drawn as a part with a connection to the hardware or process they use.
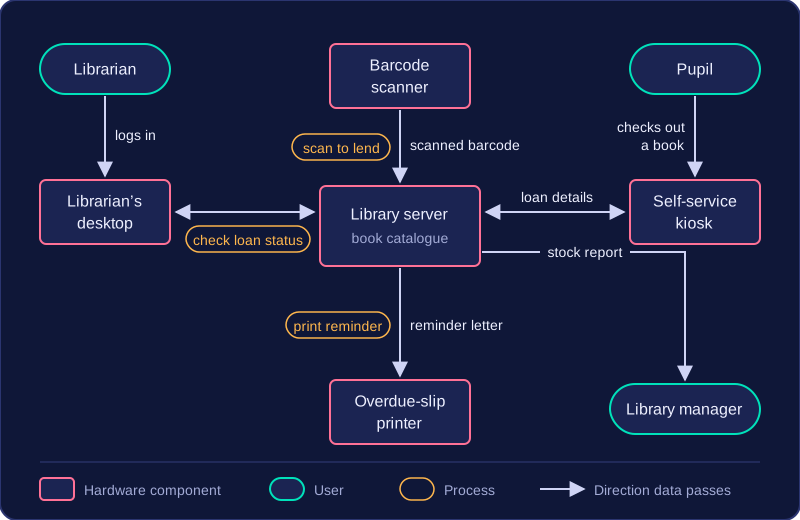
Put together, this captures a whole physical system and its components, giving a picture of the entire arrangement rather than a close-up of one device. That makes it a useful way to explain a system to someone who has never seen it, because they can follow each part, each process and each connection in one place.
Practise this
Pearson BTEC Digital Information Technology · System diagrams