System Modelling
Drawing and describing flowcharts

Drawing a flowchart means turning the steps of a scenario into standard symbols joined by arrows, so another person can follow the process from start to finish. Every step must appear in the correct order, inside the correct symbol.
Steps in the right order
Work through the scenario from beginning to end. An action becomes a process rectangle; a question answered Yes or No becomes a decision diamond; data entering or leaving becomes an input/output parallelogram. Join the shapes with arrows that point one way only.
Take a school library lending a book: Start; input the book's barcode; process a check of whether that barcode is already on loan; decision "Is the book on loan?"; Yes goes to output "Not available"; No goes to process "record the loan date", then output "Borrowed"; both paths end at End. Both exits are labelled, and there is one Start and one End.
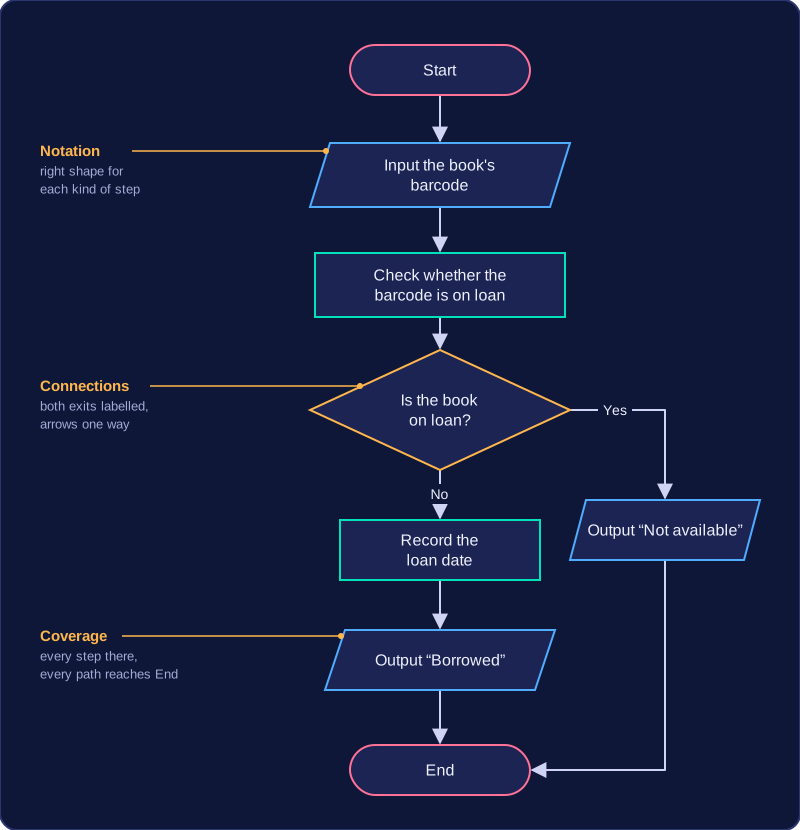
How a flowchart is marked
- Notation — the right shape and label for each kind of step.
- Connections and directions — every shape joined by an arrow, flow going forwards only, and every path reaching End.
- Coverage of the scenario — every step included, including any step needed on more than one path.
The top band needs all three mostly accurate. Your flowchart need not match a model answer: correct logic that produces the expected outcome can still earn credit. A tidy flowchart that misses a scenario step still loses coverage marks.
Describing a flowchart in words
When you describe rather than draw, include the symbols, the order of steps, what happens on each decision path, and the outcome. For the library example: "Start (oval) leads to input barcode (parallelogram), then process check loan status (rectangle), then decision 'Is the book on loan?' (diamond). Yes leads to output 'Not available' (parallelogram) and End (oval). No leads to process record the loan date, then output 'Borrowed', then End."
Practise this
Pearson BTEC Digital Information Technology · Flowcharts