System Modelling
Data flow diagram benefits and limitations

A data flow diagram is a form of notation that shows how data moves through a system. Its strengths come from what it makes easy to see, and its weaknesses come from what it leaves out.
What it helps you see
- Who and what the system interacts with. Every entity sits around the edge — the people, departments and other organisations, inside or outside the business, that send data in or receive data out — so you can see straight away that, for example, a school library system receives requests from pupils and staff and passes orders to a book supplier.
- How data moves. Following the labelled arrows shows the route a piece of data takes, from arriving, through each process, into storage and back out again.
- Where the system boundary lies. Anything drawn as an entity is outside the system and everything else is inside it, which makes the scope of a project clear to everyone who reads it.
Where it falls short
- Complexity. In a large system the flows cross each other again and again, so following one route becomes slow and mistakes are easy to miss.
- Varying symbol sets. One organisation may draw a process as a circle and another as a rounded rectangle. The meaning is unchanged, but an unfamiliar set of symbols can confuse a reader.
- No hardware or software. The notation shows what happens to data, not the devices or programs that make it happen, so it cannot be used to plan equipment purchases or to write code.
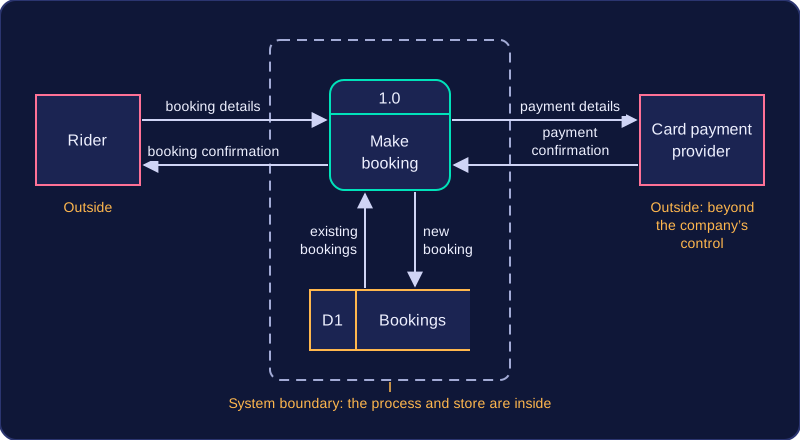
Picture a bike-hire company. A rider sends booking details to a booking process, which checks a bookings store, and a card payment provider outside the company confirms the payment; a confirmation then flows back to the rider. You can see instantly that the payment provider is beyond the company's control, which is useful. Nothing on the page tells you, though, that the booking system runs on a rented cloud server — for that you would need a different form of notation.
Practise this
Pearson BTEC Digital Information Technology · Data flow diagrams