System Modelling
Data flow diagram components

A data flow diagram is built from four components: external entities, processes, data stores and data flows. Each has its own symbol, and together the symbols show where data comes from, what happens to it, where it is kept and where it goes next.
| Component | Symbol | What it shows |
|---|---|---|
| External entity | Rectangle | A person, organisation or other system outside the system being modelled |
| Process | Rounded rectangle, or a circle in some versions | An action that transforms input data into output data |
| Data store | Open-ended rectangle, or two parallel lines | Where data is held so that it can be used again later |
| Data flow | Arrow | Data moving between components |
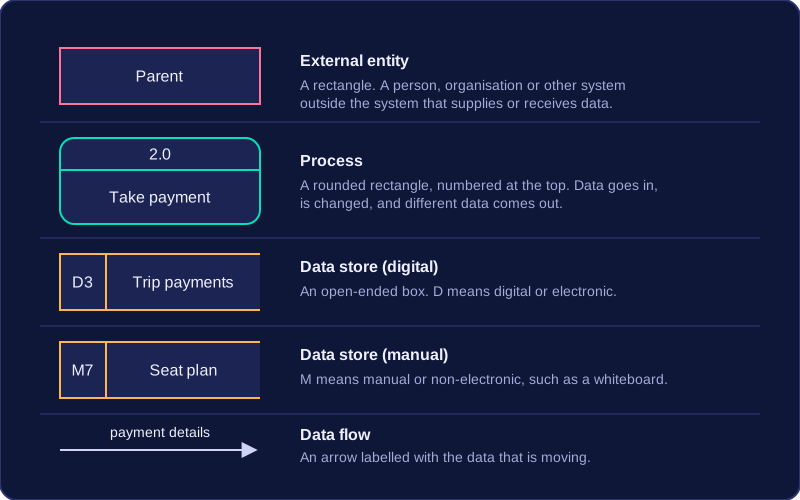
External entities sit outside the system boundary, so they are not part of the system itself. They can supply data to the system or receive data or information from it. In a system for booking school trip places, a parent and the coach company could both be external entities.
A process is where work is carried out on data: data goes in, it is changed in some way, and different data comes out. Process symbols are often numbered, such as process 2, so that each one can be referred to clearly.
A data store is where data is kept after a process has used it, so it can be used again later. Data stores are often labelled to show the form of storage: D means digital or electronic, such as D3 trip payments, while M means manual or non-electronic, such as M7, the whiteboard seat plan for each coach kept in the staff room.
Data flows are the arrows, and they are usually labelled with the data that is moving, for example “payment details” or “trip confirmation”. The label is important because the arrow alone shows only the direction, not what is travelling.
Different versions of data flow diagrams may use slightly different symbols: a process might be a rounded rectangle or a circle, while an external entity is a rectangle. The meaning of each component stays the same, so read the shape together with its label rather than relying on the shape alone.
Practise this
Pearson BTEC Digital Information Technology · Data flow diagrams