System Modelling
Data flow diagrams

A data flow diagram is a diagram that shows how data moves through a system. It follows data from its source, through any storage or processing, to its final destination, so it shows where data comes from, where it is stored, how it is processed and where it goes. Rather than showing every tiny step a person takes, it gives a clear map of the data itself.
What a data flow diagram shows
Each part of the system is shown by a symbol, and arrows show the direction in which data travels. For example, in a bike repair shop's booking system, a customer's repair request enters the system, is checked and recorded as a booking, and a confirmation is sent back to the customer. The diagram makes it easy to see the request, the processing, the stored booking and the confirmation as connected pieces of data.
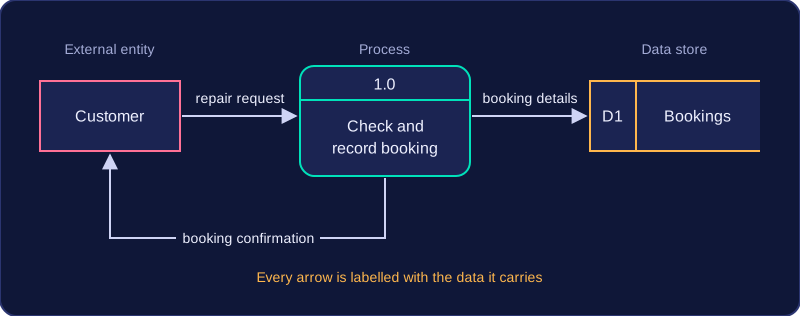
A data flow diagram is not a flowchart. A flowchart shows the order in which actions happen, often with decisions and loops. A data flow diagram shows the movement and transformation of data between parts of a system; it does not show sequence or timing.
Why organisations use them
Organisations use data flow diagrams to explain their systems, data and information to people such as new staff, managers or clients. The diagram gives a shared picture of what data enters, what happens to it and where it ends up, which is easier to discuss than a long written description.
Database developers often use data flow diagrams to explain how different data is connected. When a school library team is planning a new database, for example, they can use one to agree which details about books and borrowers are needed, where those details are stored, and which processes use them before any tables are built.
Practise this
Pearson BTEC Digital Information Technology · Data flow diagrams