System Modelling
Flowcharts

A flowchart is a form of notation that explains a system or process by showing the sequence of actions carried out as data enters, moves through and leaves it. Each step is written inside a shape and joined to the next by an arrow, so a reader can follow the whole process from beginning to end.
The steps sit in a fixed order, so a flowchart records the order in which tasks are completed. A written description can cover the same process, but the reader has to work out the order for themselves. A flowchart makes that order visible, which is why organisations use it as notation to explain how a system or process works.
The parts every flowchart sets out
| Part | What it shows |
|---|---|
| Start | The defined beginning of the process |
| Input | Data entering the system |
| Process | An action or calculation carried out on the data |
| Decision | A point where the flow splits into two possible paths, depending on the answer |
| Output | Data leaving the system, such as a price shown on a screen |
| End | The defined finish, where the process stops |
A worked example
A leisure centre hires out lockers. Its flowchart starts, then takes in the number of hours a customer wants. A process works out the hourly cost by multiplying the hours by £1.50. A decision then asks a yes/no question: is the number of hours more than four? The Yes path uses the day rate of £6 instead, while the No path keeps the hourly cost. Either way the flow reaches an output, which shows the amount to pay, and then the end.
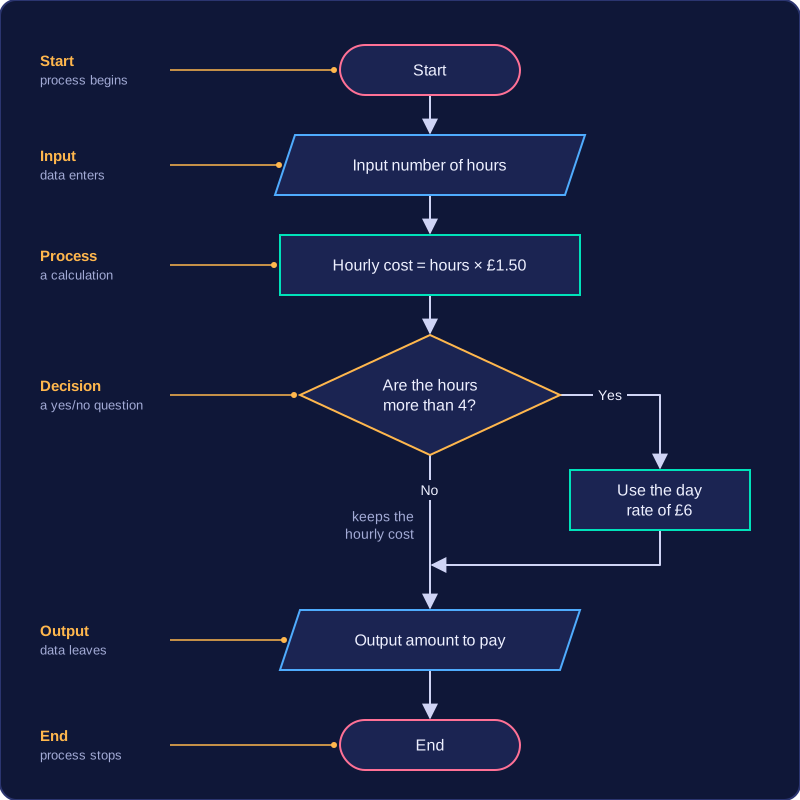
Here one set of data enters as a number of hours, moves through a calculation and a decision, and leaves as a price, with a clear start and end marking where the process begins and finishes.
Practise this
Pearson BTEC Digital Information Technology · Flowcharts