Data Representation
Sound
Contents
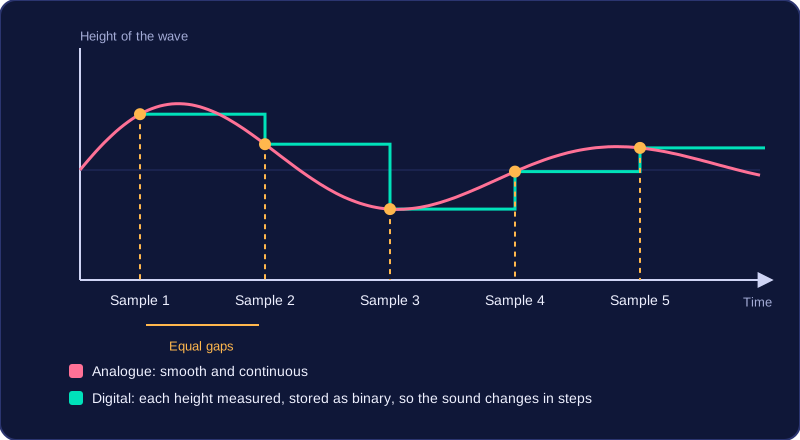
Analogue signals change smoothly and continuously. A microphone turning a voice into a changing voltage is analogue: at any instant the voltage can take any value in its range, and it never jumps from one value to the next. Digital data is different. It is stored as binary, using only 1s and 0s, so it can only take a fixed set of discrete values.
A computer cannot store a continuously changing wave directly, so it measures the wave at regular intervals. Each measurement records the wave's height at that instant, and is stored as a binary number.
Why the intervals must be regular
Suppose a drummer hits a cymbal and the sound rises and falls over half a second. Measuring at five equally spaced moments gives five height values. Stored as binary, those five numbers let software rebuild an approximate version of the sound. If you measured only once, you would know how loud the cymbal was at that instant, but not how the sound changed before or after. The regular spacing also lets the computer match each binary value to a point in time when it rebuilds the wave. Spacing that varied would shift sounds to the wrong moments, so the timing would be wrong even if every value were stored correctly.
| Analogue sound | Digital sound | |
|---|---|---|
| Values | Continuous; any value in a range | Discrete; only binary values |
| Change | Smooth, with no jumps | Changes in steps from one stored number to the next |
| Computer storage | Cannot be stored directly | Stored as measurements converted to binary |
Music, speech and every other sound reaches your ear as an analogue wave — a signal that rises and falls smoothly, with no gaps. A computer cannot store a smooth curve, only numbers, so something has to measure the wave for it. An analogue-to-digital converter (ADC) does that job: it takes measurements of the wave and turns each one into a number that the computer keeps as binary.
Each measurement is a sample
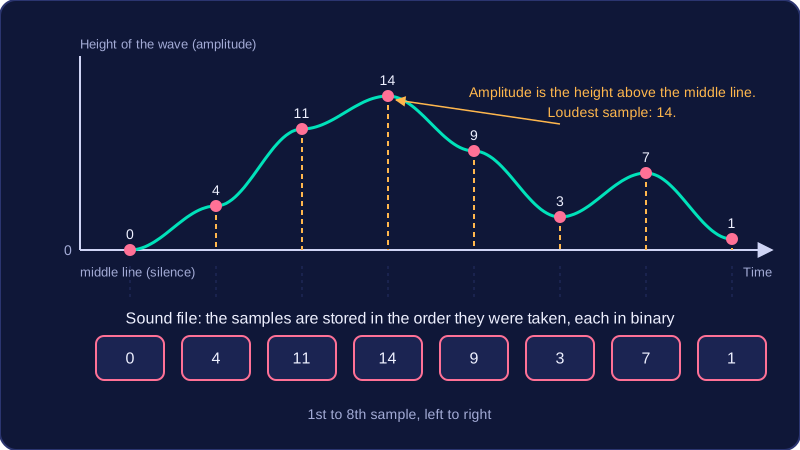
Every measurement the ADC takes is called a sample. At that instant the converter looks at the height of the wave and records it as a value, which is stored in binary. A sound file is therefore just a sequence of binary sample values, held in the order they were taken. The computer plays the sound back by working through that sequence from first value to last and rebuilding the wave.
For example, a hand clap might be measured eight times and give the heights 0, 4, 11, 14, 9, 3, 7, 1. The sound file holds those eight numbers one after another, each written in binary, so the loudest moment of the clap is the value furthest from zero.
Amplitude means loudness
Amplitude is the height of the wave above or below its resting, middle position at a given point. It is the measurement a sample records. A wave that swings far above and below the middle line has a large amplitude and sounds loud; a flattened wave that stays close to the middle line has a small amplitude and sounds quiet. Silence sits on the middle line with an amplitude of zero, so a sample taken in silence is stored as 0. Because each sample stores amplitude, a value further from zero means a louder moment in the recording.
Sample rate is the number of samples taken each second. It is measured in hertz (Hz), where 1 Hz means one sample every second. A rate of 400 Hz means the computer measures the wave's amplitude 400 times during each second of the recording.
More samples, more detail
Taking more samples each second records more points along the wave. The measurements sit closer together, so the stored values follow the shape of the wave more closely. Quick rises and falls are picked up rather than stepped over, so the recording keeps more of the detail of the original sound.
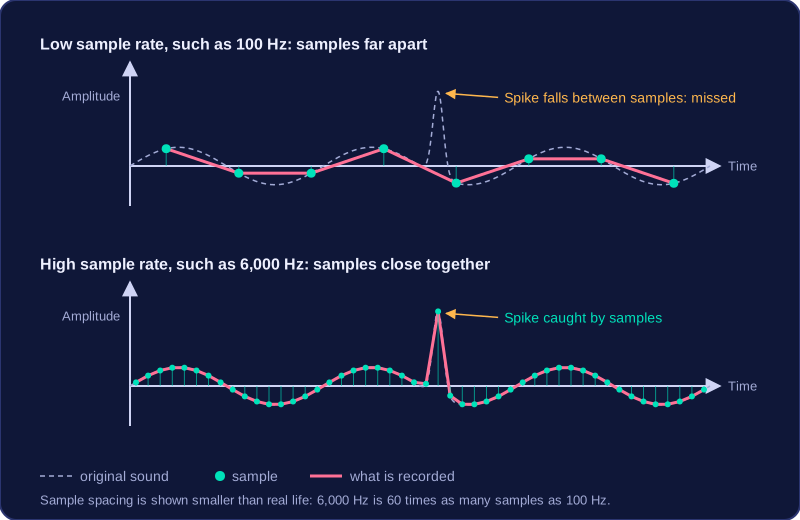
Imagine recording a balloon bursting. The bang is a sudden spike that lasts only a moment. At 100 Hz the computer takes just 100 samples in that second, with large gaps between them, so the spike could easily happen between two samples and be lost. At 6,000 Hz it takes thousands of samples, so the spike is much more likely to be caught.
| Sample rate | Samples each second | Effect on the recording |
|---|---|---|
| Low | Few | Rapid changes between samples can be missed |
| High | Many | Follows the wave closely and keeps more detail |
When the rate is too low
A low sample rate takes measurements far apart. If the wave changes quickly between two samples, such as a drum hit or the start of a note, that change may not be recorded at all. The digitised sound then differs from the original, and a short, sharp sound can end up quieter and less sharp than it really was. A higher sample rate makes missing these rapid changes less likely.
Sample rate only controls how often the wave is measured. How accurately each measurement is stored is a separate idea: bit depth.
Sample interval is the amount of time between one sample and the next when a sound wave is being digitised. It is a fraction of a second — often a few thousandths or millionths — because a computer takes thousands of measurements every second.
The interval and the sample rate are reciprocals: each one is 1 divided by the other. If a sampler measures the wave every 0.002 seconds, it manages 1 ÷ 0.002 = 500 samples in a second, so the sample rate is 500 hertz.
Shorter interval, more samples
Making the interval shorter means less time passes between measurements, so more samples land on the wave during the same second. That is the same thing as saying the sample rate is higher. The two values always pull in opposite directions: halve the interval and you double the rate.
| Sample interval (seconds) | Sample rate (samples per second) |
|---|---|
| 0.01 | 100 |
| 0.001 | 1000 |
| 0.0001 | 10 000 |
Turning a rate into an interval
Divide 1 by the sample rate. A rate of 8000 hertz gives an interval of 1 ÷ 8000 = 0.000125 seconds, which is 0.125 milliseconds.
Bit depth, also called sample resolution, is the number of bits used to store each sample. A sample is one measurement of the height of a sound wave, so the bit depth sets how precisely that height can be written down in binary.
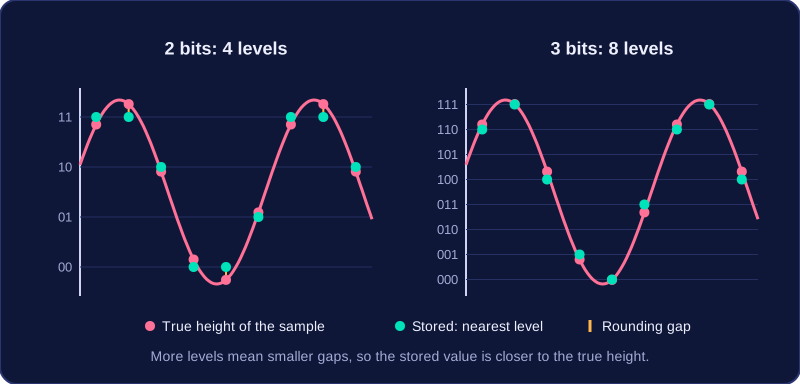
With a bit depth of n bits, there are 2^n possible amplitude values. For example, 3 bits give 2^3 = 8 values, while 6 bits give 2^6 = 64 values. Each extra bit doubles the number of levels available.
| Bit depth | Calculation | Possible amplitude values |
|---|---|---|
| 2 bits | 2 ** 2 | 4 |
| 4 bits | 2 ** 4 | 16 |
| 8 bits | 2 ** 8 | 256 |
A higher bit depth records the height of each sample more accurately. The real height usually falls between two available values, so the recorder stores the nearest one. More levels mean smaller gaps between them, so the rounding error is smaller and the stored amplitude is closer to the true amplitude.
Bit depth changes precision, not timing: it does not decide how often samples are taken. It is also not the same as colour depth, which is used for images.
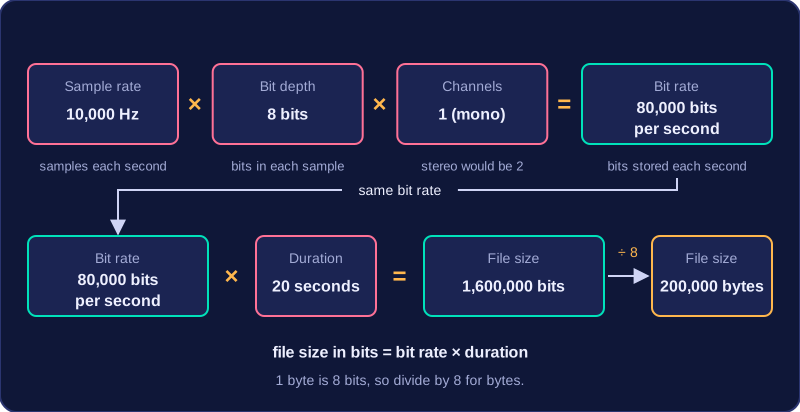
Bit rate is the number of bits stored for every second of sound. You work it out by multiplying the sample rate by the bit depth, then by the number of channels: bit rate = sample rate × bit depth × channels. A mono recording at 12,000 Hz with a bit depth of 8 bits has a bit rate of 12,000 × 8 × 1 = 96,000 bits per second. Stereo stores two channels, so the same recording has twice that bit rate. Bit rate is a good measure of both quality and file size, because it counts the bits stored for each second.
Working out file size
For an uncompressed sound file, the size depends on the sample rate, bit depth, duration and number of channels. Mono uses one channel; stereo uses two. Because bit rate already counts the channels, the formula is:
file size in bits = bit rate × duration = sample rate × bit depth × channels × duration
A 20-second mono recording at 10,000 Hz with a bit depth of 8 bits has a bit rate of 80,000 bits per second. Its file size is 80,000 × 20 = 1,600,000 bits, which is 200,000 bytes.
# Work out the bit rate and file size of an uncompressed recording
sample_rate = int(input('Sample rate in Hz: '))
bit_depth = int(input('Bit depth in bits: '))
duration = int(input('Duration in seconds: '))
channels = int(input('Number of channels: '))
bit_rate = sample_rate * bit_depth * channels
total_bits = bit_rate * duration
print('Bit rate: ' + str(bit_rate) + ' bits per second')
print('File size: ' + str(total_bits) + ' bits')
print('Size in bytes: ' + str(total_bits // 8))
Output when the user types 10000, 8, 20, 1:
Sample rate in Hz: 10000
Bit depth in bits: 8
Duration in seconds: 20
Number of channels: 1
Bit rate: 80000 bits per second
File size: 1600000 bits
Size in bytes: 200000
Quality and file size trade-off
Raising the sample rate means more samples are taken each second, so fast changes in the wave are captured more closely. Raising the bit depth means each sample is stored more precisely. Both improve quality, but both raise the bit rate and the file size. Bit rate is not bit depth: bit depth is the number of bits for one sample, while bit rate is the number of bits for one second of sound.
| Setting | Sample rate | Bit depth | Bit rate | File size for 20 s mono |
|---|---|---|---|---|
| A | 10,000 Hz | 8 bits | 80,000 bits per second | 1,600,000 bits (200,000 bytes) |
| B | 20,000 Hz | 16 bits | 320,000 bits per second | 6,400,000 bits (800,000 bytes) |
Setting B stores four times as many bits each second as setting A, so its file is four times larger, but it keeps more detail. Lowering either value saves space but loses quality.
A digitised sound can be shown on a graph. Time goes on the horizontal axis and amplitude goes on the vertical axis. Amplitude is the height of the sound wave at that moment. The graph lets you see the pattern of the samples stored in the file.
To plot the graph, work through the samples in order. For each sample, use its time as the x-coordinate and its stored amplitude as the y-coordinate, then mark a point. For example, one hit on a drum pad in a music app might give these samples:
| Time (s) | 0.0 | 0.2 | 0.4 | 0.6 | 0.8 |
|---|---|---|---|---|---|
| Amplitude | 9 | 6 | 3 | 1 | 0 |
Plotting those points gives (0.0, 9), (0.2, 6), (0.4, 3), (0.6, 1) and (0.8, 0). Join each point across to the next sample time at the same amplitude, then up or down to the next sample. This gives a stepped digital waveform, not a smooth curve. Between one sample and the next, the value is shown held at the same level, so the line stays flat and then jumps sharply at the next sample. That is why the graph looks like a set of steps.
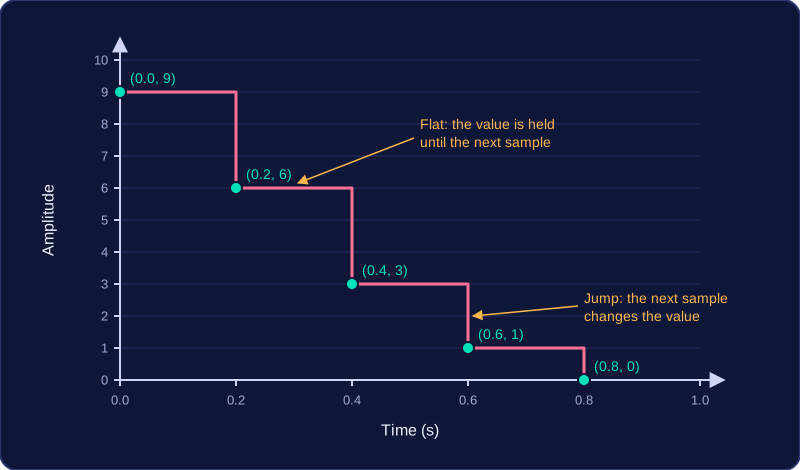
The steps are a picture of the digital data: each flat section shows the amplitude recorded at the last sample, and each jump shows where the next sample changes it.
A digital recording is only an approximation of the original analogue sound wave. The computer does not store the smooth curve itself; it stores measurements taken at particular moments and saves each measurement using a limited number of bits.
Rounding each sample
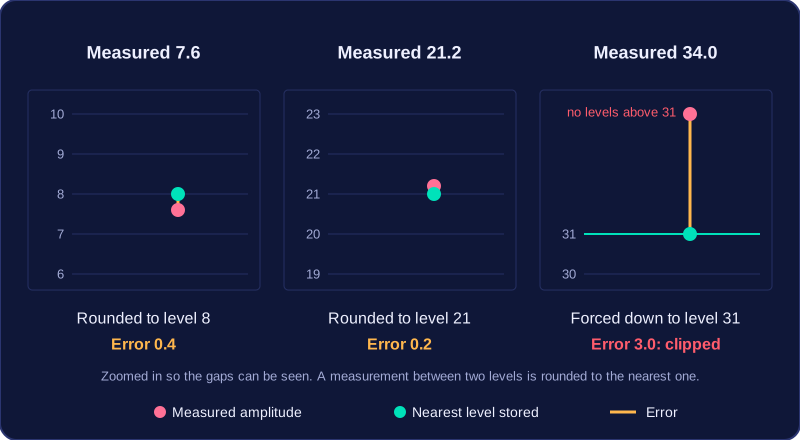
With a fixed bit depth, there are only a set number of amplitude values available. If a sample's measured amplitude falls between two of those values, it is rounded to the nearest one. That small difference is the rounding error. For example, a 5-bit system has 32 levels, numbered 0 to 31:
| Measured amplitude | Nearest available level | Error |
|---|---|---|
| 7.6 | 8 | 0.4 |
| 21.2 | 21 | 0.2 |
| 34.0 | 31 (maximum) | 3.0, clipped |
The first two samples are close to a stored level, so the error is small. The third is louder than the highest level the system can store, so it cannot be recorded properly; it is forced down to 31 and the loud peak is clipped.
More bits still isn't exact
Increasing the bit depth gives more possible levels and a wider range of amplitudes. The gaps between neighbouring levels get smaller, so rounding errors shrink and fewer peaks are clipped. But the original wave is continuous: between any two stored levels there are infinitely many possible amplitudes. No matter how many bits you use, a measured value can still land between two levels and need rounding. Also, only the values at the sample moments are stored, so anything happening between samples is missed. A higher bit depth improves the approximation but can never make the digital copy exact.