What Makes a Product Financially Viable
How to use break-even for decision making
Contents
Break-even is the point at which a business's total revenue equals its total costs, so it makes neither a profit nor a loss. The break-even quantity is the number of units a business must sell to cover all of its costs.
At break-even, profit is zero. The business has sold enough to pay for everything it spent, but nothing more. Each unit sold beyond that point starts to add profit, and each unit short of it leaves a loss.
Measured in units, not pounds
Break-even quantity is a number of units sold, such as 80 units or 1,200 units. Writing it with a money sign is wrong: £80 is an amount of money, while 80 units is a quantity of items. On a break-even graph, the break-even point can be read as both output and a money value, but a break-even quantity on its own is a number of units.
Worked example
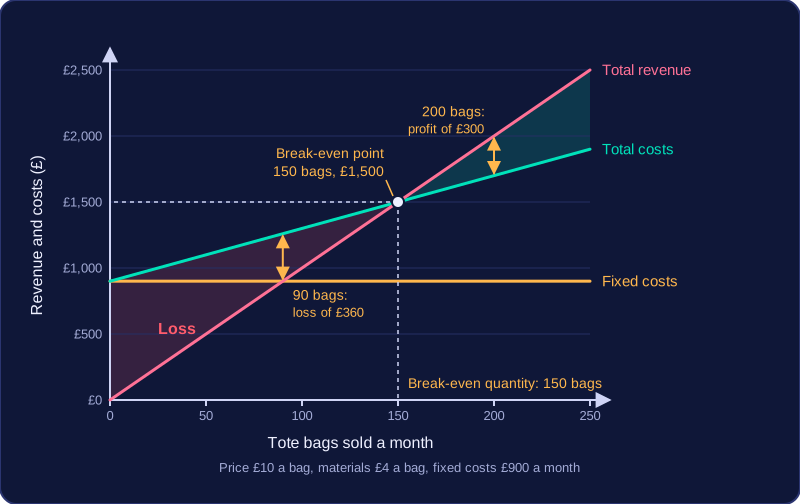
A student enterprise hand-prints tote bags and sells them for £10 each. Materials cost £4 a bag and fixed costs are £900 a month. Each bag leaves £6 (£10 − £4) to go towards the fixed costs, so the break-even quantity is £900 ÷ £6 = 150 bags a month.
Check it: 150 bags bring in 150 × £10 = £1,500 of revenue. Total costs are £900 + (150 × £4) = £1,500. Revenue and costs match, so profit is £0 and the business has broken even. Selling 90 bags would leave a loss; selling 200 would make a profit.
A planning calculation, not a promise
Break-even is worked out from expected costs and prices before trading happens. It tells you how many units would need to be sold to cover costs, but it cannot promise that customers will actually buy that many. It is a target to aim at, not a forecast of real sales.
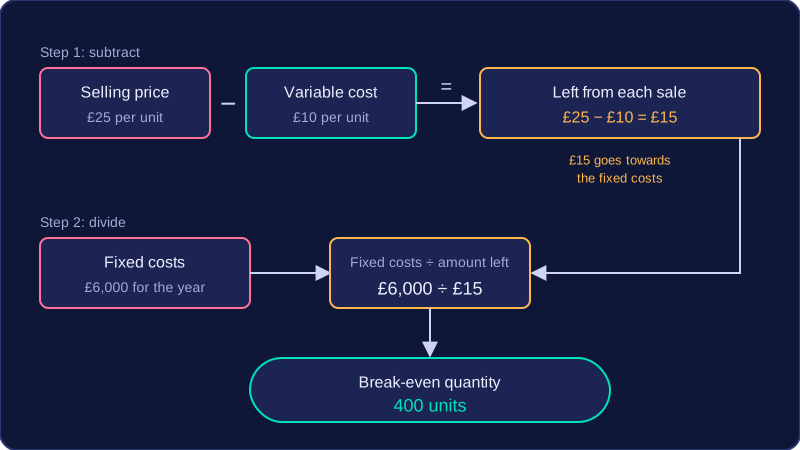
The break-even quantity is the number of units a business must sell to cover all of its costs. The formula is: break-even quantity = fixed costs ÷ (selling price per unit − variable cost per unit). Work it out by subtracting the variable cost per unit from the selling price per unit, then dividing the fixed costs by the result.
The selling price per unit is the amount charged for one unit. The variable cost per unit is the cost of the materials and packaging needed for one unit, plus any other costs that change with output. The amount left after this subtraction is the money from each sale that is available to cover fixed costs. Divide the fixed costs by this amount to get the break-even quantity.
For example, a business has fixed costs of £6,000 for the year. It sells each unit for £25 and the variable cost per unit is £10. First, £25 − £10 = £15. This £15 from each sale goes towards covering the £6,000 of fixed costs. Then £6,000 ÷ £15 = 400 units. The business must sell 400 units in the year to cover all of its costs.
Write the subtraction step before the division, because marks are often available for correct workings even if the final answer is wrong. Make sure the fixed costs and the time period of the break-even quantity match. If fixed costs are £500 a month but you need the break-even quantity for a year, first change the fixed costs to a yearly figure: £500 × 12 = £6,000. Then use that £6,000 in the formula.
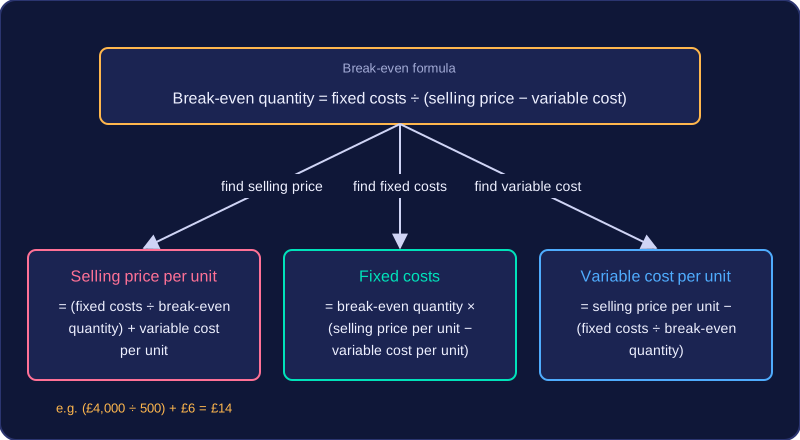
You can rearrange the break-even formula to work backwards when you know the break-even quantity and two of the three money amounts. Write the rearranged formula first, then put in the figures and check your answer.
Working out the selling price per unit
Selling price per unit = (fixed costs ÷ break-even quantity) + variable cost per unit.
Worked example: break-even quantity is 500 units, fixed costs are £4,000 and variable cost per unit is £6.
Selling price per unit = (£4,000 ÷ 500) + £6 = £8 + £6 = £14.
Check it by putting £14 back into the original break-even formula: 500 × (£14 − £6) = 500 × £8 = £4,000 fixed costs. The answer is correct.
Finding fixed costs
Fixed costs = break-even quantity × (selling price per unit − variable cost per unit).
The amount left from each sale is the selling price per unit minus the variable cost per unit. It is the money from each sale left to cover fixed costs, so multiplying it by the number of units gives the total fixed costs covered at break-even.
Finding variable cost per unit
Variable cost per unit = selling price per unit − (fixed costs ÷ break-even quantity).
Dividing fixed costs by the break-even quantity shows the fixed cost each unit must cover. Taking this from the selling price leaves the variable cost per unit.
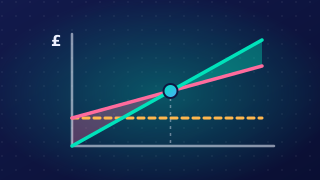
A break-even graph shows how a business's total revenue and total costs change as it sells more units. It helps you see the output needed to cover all costs and whether the business is making a profit or a loss.
The horizontal axis shows quantity or output, such as the number of tote bags sold. The vertical axis shows money, used for both costs and revenue. The fixed costs line is horizontal because fixed costs stay the same at every level of output. The total revenue line starts at zero, because selling nothing earns nothing, and rises as sales increase. The total costs line starts at the fixed costs level, not at zero, because fixed costs are paid even when output is zero. It then rises as variable costs are added with each unit made.
The break-even point is where the total revenue line crosses the total costs line. It is not where total revenue crosses the fixed costs line, because covering fixed costs alone does not pay the variable costs. The break-even output is read from the horizontal axis at this point. The money value of total revenue and total costs at break-even is read from the vertical axis.
Below the break-even output, total costs are greater than total revenue, so the business makes a loss. Above it, total revenue is greater than total costs, so the business makes a profit.
For example, a business selling printed tote bags has fixed costs of £200 a month, a variable cost of £3 per bag and a selling price of £8 per bag. Its total revenue line and total costs line cross at 40 bags, where both are £320. At 20 bags, revenue is £160 and total costs are £260, a £100 loss. At 60 bags, revenue is £480 and total costs are £380, a £100 profit.
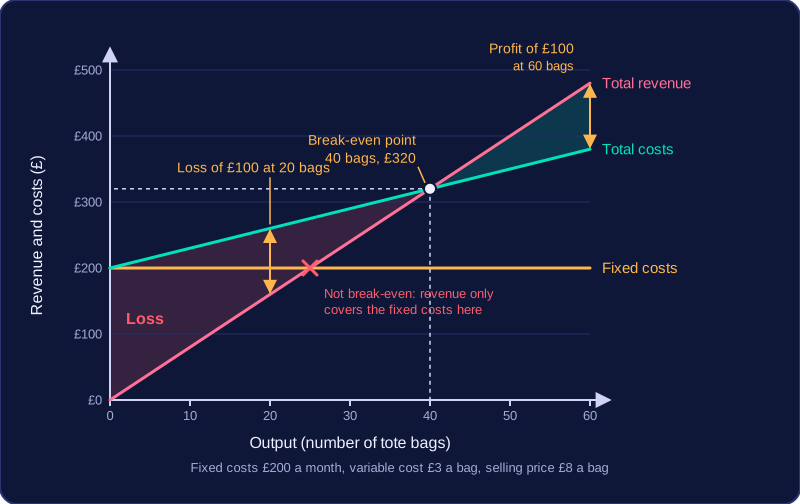
To complete a graph, plot total revenue and total costs from the data, draw both lines and mark where they cross.
Break-even quantity is the number of units a business must sell to cover its total costs. It depends on three figures: fixed costs, variable cost per unit and selling price per unit. Change one of these while the other two stay the same, and the break-even quantity moves.
Higher costs raise break-even
If fixed costs rise, the total costs line starts at a higher level. There are more costs to cover before the business breaks even, so it must sell more units. Take printed tote bags with fixed costs of £600 a month, a selling price of £15 and a variable cost of £6: £600 ÷ (£15 − £6) = 66.7, so 67 bags (round up). If fixed costs rise to £720, break-even becomes £720 ÷ £9 = 80 bags.
If the variable cost per unit rises, the total costs line becomes steeper, and the gap between the selling price and the variable cost shrinks, so more units are needed. A variable cost of £7.50 leaves £15 − £7.50 = £7.50 per bag, so break-even is £600 ÷ £7.50 = 80 bags.
A higher selling price lowers break-even
If the selling price rises, the total revenue line becomes steeper: each sale brings in more money to cover fixed costs, so fewer sales are needed. A price of £18 gives £600 ÷ (£18 − £6) = 50 bags, and a lower price would have the opposite effect and raise break-even.
Judging the effect
A lower break-even quantity is usually better because fewer sales are needed to cover costs. A higher break-even is not automatically better, because rising costs usually cause it. Lower fixed costs or a lower variable cost per unit would lower break-even; a lower selling price would raise it. Take each change on its own, with the other figures unchanged, so name the figure that is changing.
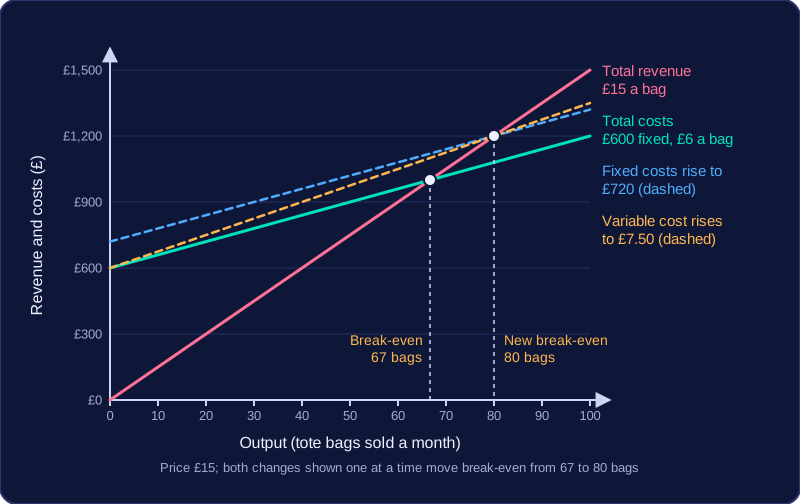
| Change (one at a time) | New break-even quantity | Effect |
|---|---|---|
| Fixed costs rise from £600 to £720 | 80 bags | Higher |
| Variable cost per bag rises from £6 to £7.50 | 80 bags | Higher |
| Selling price rises from £15 to £18 | 50 bags | Lower |
Break-even information tells an entrepreneur how many units they must sell before they start to make a profit. It is a planning tool: it helps someone judge whether an idea is financially viable (worth going ahead with) and supports decisions before money is spent. Remember that the break-even quantity is a number of units, not money.
What entrepreneurs use it for
- Checking viability: if break-even works out at 4,000 units a month but the likely market is only a few hundred, the idea probably will not work.
- Setting sales targets: the break-even quantity becomes the minimum sales target to beat, and every unit sold after that adds profit, so a lower break-even quantity is usually better.
- Pricing decisions: a higher selling price usually lowers the break-even quantity, because each sale covers more of the fixed costs. A lower price raises it.
- Budgeting and cost planning: it shows what happens if fixed costs (such as rent) or variable costs (such as materials per unit) change, so the entrepreneur can plan spending.
- Comparing options: work out the break-even quantity for each product or price separately, then compare the answers and find the difference. Never add two products' costs and prices together before using the formula, as that gives a meaningless figure.
- Marketing and production: it shows how many units to make and how much promotion is needed to reach the sales required to cover costs.
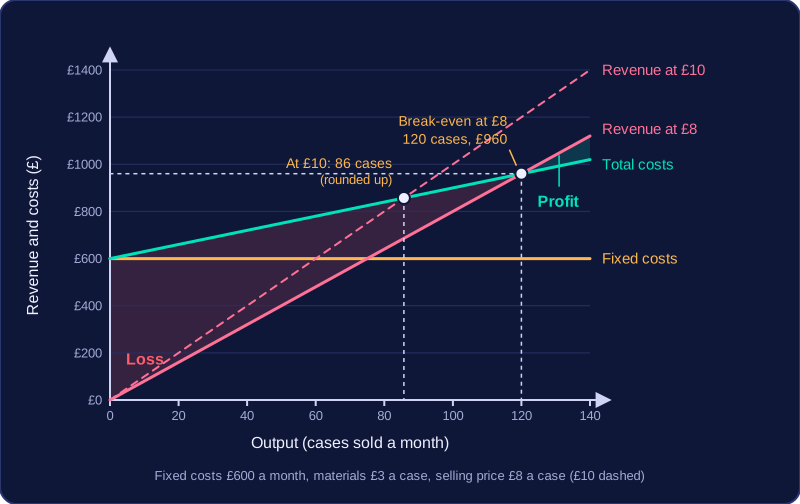
A student selling personalised phone cases has fixed costs of £600 a month for a market stall and a printer lease. Each case sells for £8 and uses £3 of materials. Break-even is £600 ÷ (£8 − £3) = 120 cases a month. Raising the price to £10 lowers break-even to £600 ÷ £7 = 86 cases (rounded up), so 34 fewer sales are needed, but only if customers still buy at £10.
What it cannot do
Break-even shows the sales needed to cover costs, but it is not a guarantee that those sales will happen: it is built on expected costs and prices, and demand can differ.