How to use break-even for decision making
Break-even graph
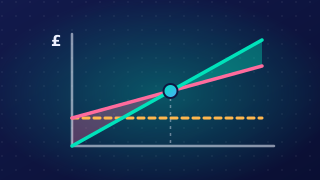
A break-even graph shows how a business's total revenue and total costs change as it sells more units. It helps you see the output needed to cover all costs and whether the business is making a profit or a loss.
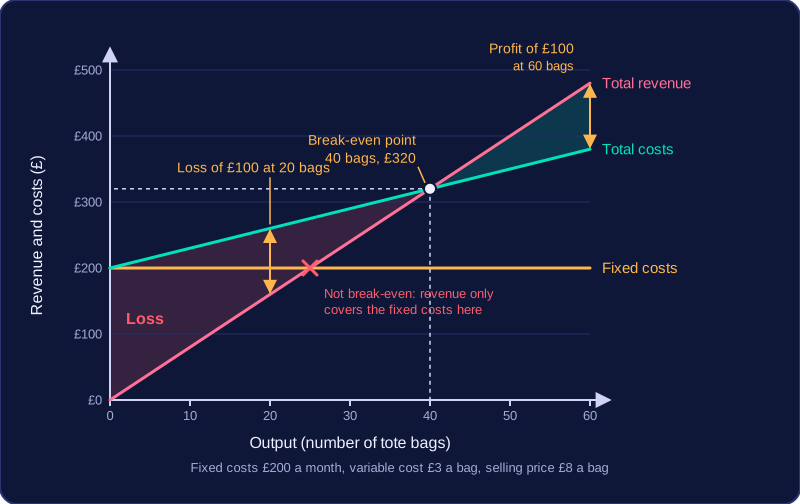
The horizontal axis shows quantity or output, such as the number of tote bags sold. The vertical axis shows money, used for both costs and revenue. The fixed costs line is horizontal because fixed costs stay the same at every level of output. The total revenue line starts at zero, because selling nothing earns nothing, and rises as sales increase. The total costs line starts at the fixed costs level, not at zero, because fixed costs are paid even when output is zero. It then rises as variable costs are added with each unit made.
The break-even point is where the total revenue line crosses the total costs line. It is not where total revenue crosses the fixed costs line, because covering fixed costs alone does not pay the variable costs. The break-even output is read from the horizontal axis at this point. The money value of total revenue and total costs at break-even is read from the vertical axis.
Below the break-even output, total costs are greater than total revenue, so the business makes a loss. Above it, total revenue is greater than total costs, so the business makes a profit.
For example, a business selling printed tote bags has fixed costs of £200 a month, a variable cost of £3 per bag and a selling price of £8 per bag. Its total revenue line and total costs line cross at 40 bags, where both are £320. At 20 bags, revenue is £160 and total costs are £260, a £100 loss. At 60 bags, revenue is £480 and total costs are £380, a £100 profit.
To complete a graph, plot total revenue and total costs from the data, draw both lines and mark where they cross.
Practise this
Cambridge National Enterprise & Marketing · 3.4 How to use break-even for decision making