How to use break-even for decision making
Break-even
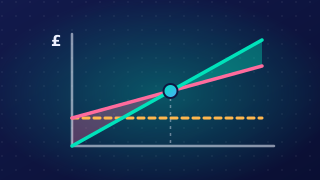
Break-even is the point at which a business's total revenue equals its total costs, so it makes neither a profit nor a loss. The break-even quantity is the number of units a business must sell to cover all of its costs.
At break-even, profit is zero. The business has sold enough to pay for everything it spent, but nothing more. Each unit sold beyond that point starts to add profit, and each unit short of it leaves a loss.
Measured in units, not pounds
Break-even quantity is a number of units sold, such as 80 units or 1,200 units. Writing it with a money sign is wrong: £80 is an amount of money, while 80 units is a quantity of items. On a break-even graph, the break-even point can be read as both output and a money value, but a break-even quantity on its own is a number of units.
Worked example
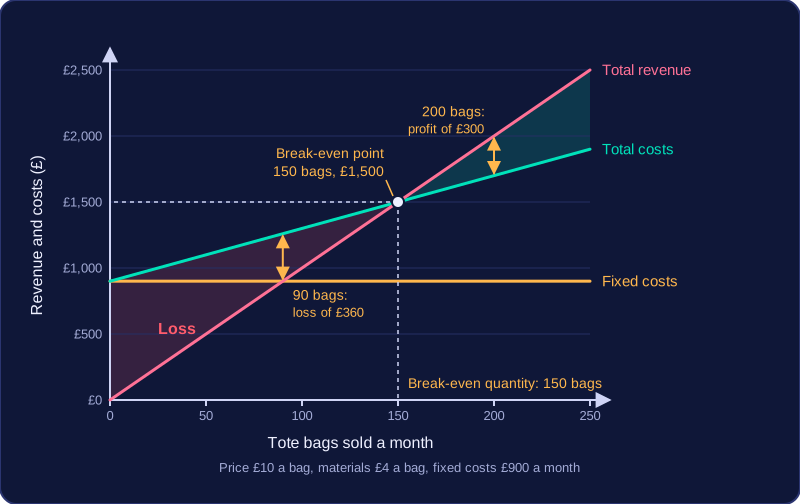
A student enterprise hand-prints tote bags and sells them for £10 each. Materials cost £4 a bag and fixed costs are £900 a month. Each bag leaves £6 (£10 − £4) to go towards the fixed costs, so the break-even quantity is £900 ÷ £6 = 150 bags a month.
Check it: 150 bags bring in 150 × £10 = £1,500 of revenue. Total costs are £900 + (150 × £4) = £1,500. Revenue and costs match, so profit is £0 and the business has broken even. Selling 90 bags would leave a loss; selling 200 would make a profit.
A planning calculation, not a promise
Break-even is worked out from expected costs and prices before trading happens. It tells you how many units would need to be sold to cover costs, but it cannot promise that customers will actually buy that many. It is a target to aim at, not a forecast of real sales.
Practise this
Cambridge National Enterprise & Marketing · 3.4 How to use break-even for decision making