Algorithms
Flowcharts

Contents
A flowchart is a diagram of an algorithm. Each step of the algorithm sits inside a standard symbol, and arrows join the symbols together so the order in which things happen is clear.
The arrows show the flow of control: they tell you which step runs next. Where the arrows lead straight on, one step simply follows another. Where a step asks a question, the arrows split so that one route runs when the answer is yes and a different route runs when the answer is no. A route that turns back and rejoins an earlier part of the chart means those steps are repeated.
All three constructs in one picture
Because the arrows set the order in which steps run, a single flowchart can represent sequence, selection and iteration together:
- Sequence — each step is shown once and runs in the order the arrows give.
- Selection — a question with two possible routes, so only one set of steps runs.
- Iteration — an arrow that returns to an earlier symbol, so the steps between are run again.
For example, a flowchart for a theme park ride could ask for a rider's height, send tall enough riders down one route and shorter riders down another, then loop back to check the next person in the queue until the queue is empty. One chart holds the decisions and the repetition together.
Why plan on paper first?
Drawing the algorithm before you write any code lets you test your thinking with a pencil: missing steps, wrong order and routes that never end are much easier to spot in a diagram than in a program. Fixing them there saves time later.
The symbols are standard, so a flowchart makes sense to anyone who knows the convention, whatever programming language they use.
Every step in a flowchart is drawn with a standard symbol, so its shape tells you the job that step does before you even read the label. These are the six symbols you need.
| Symbol | Shape | Used for |
|---|---|---|
| Terminal | Rounded rectangle | The start and the end of the algorithm, labelled Start and Stop (or End) |
| Input/output | Parallelogram | Data entering the algorithm, such as a value typed in, or data leaving it, such as a message shown |
| Process | Rectangle | A calculation or assignment that sets or changes a value, such as lives = lives - 1 |
| Decision | Diamond | A question with exactly two possible answers, such as Is the queue empty? |
| Sub program | Rectangle with an extra vertical line just inside its left and right edges | Run the named sub program at that point, such as shuffleDeck |
| Line | Arrow | Join two symbols and show which step follows which |
Keep the input/output and process symbols apart. A parallelogram is only for data crossing the edge of the algorithm, so a value being read in or a result being displayed belongs there. A plain rectangle is for work done inside the algorithm, like adding two marks together or storing a new high score. Getting these two the wrong way round changes what the flowchart says the program does.
The decision symbol is the one that shows selection. Only one question goes inside the diamond, and it must have exactly two possible answers, so the shape always has two exits. Label one exit Yes and the other No, or use True and False, and send each exit along its own separate path. A diamond with three exits, or with exits that are not labelled, cannot be followed reliably.
Lines are the arrows that join symbols and show the order of the steps. They normally run downwards. Every symbol is joined to the next by an arrow, and the Stop terminal is the only symbol with no arrow leaving it; a decision has two arrows leaving it, one for each exit.
A correct flowchart follows a small set of rules. Use them as a checklist whenever you complete, correct or refine one.
- One Start: exactly one terminal marked Start. More than one gives no single entry point, so a reader cannot tell where the algorithm begins.
- Every path reaches Stop: follow each arrow from Start; every route must finish at a Stop terminal. A branch that ends nowhere is incomplete.
- Arrows join every symbol: flow of control is shown by lines with arrowheads, not by position. An unconnected symbol is never run.
- Two labelled exits per decision: a diamond asks a question and must have exactly one Yes and one No exit, both labelled. An unlabelled exit, or a third exit, is an error.
- Right symbol for the purpose: input and output go in a parallelogram, calculations and assignments in a rectangle, questions in a diamond, and Start or Stop in a rounded terminal.
- Named values: store results in names such as
scoreorattemptsso later symbols can refer to them.
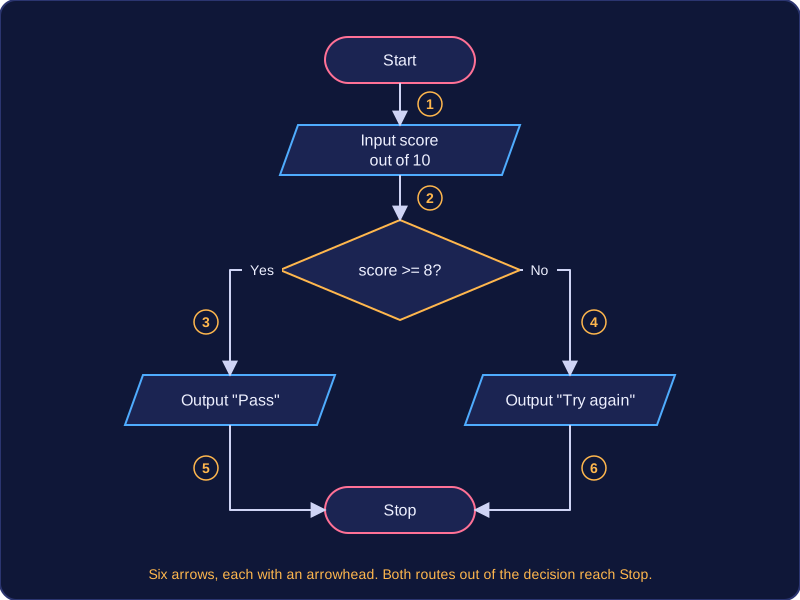
Worked example: a flowchart for a bike-hire kiosk asks for hours hired in an input parallelogram, calculates cost as hours multiplied by 4 in a process rectangle, then asks whether cost is over 20 in a decision diamond. It outputs "Pay deposit" on Yes and "No deposit" on No, and both exits lead to Stop. If the Yes exit had no label, or the calculation sat in a parallelogram, correcting the flowchart would mean fixing that label or shape.
Completing may mean adding a missing arrow, label, symbol or loop update and reconnecting the parts, so the flowchart follows the rules and solves the given problem. Refining means improving a working flowchart: correcting errors, making the order clearer, or using nesting and a sub program symbol to organise it.
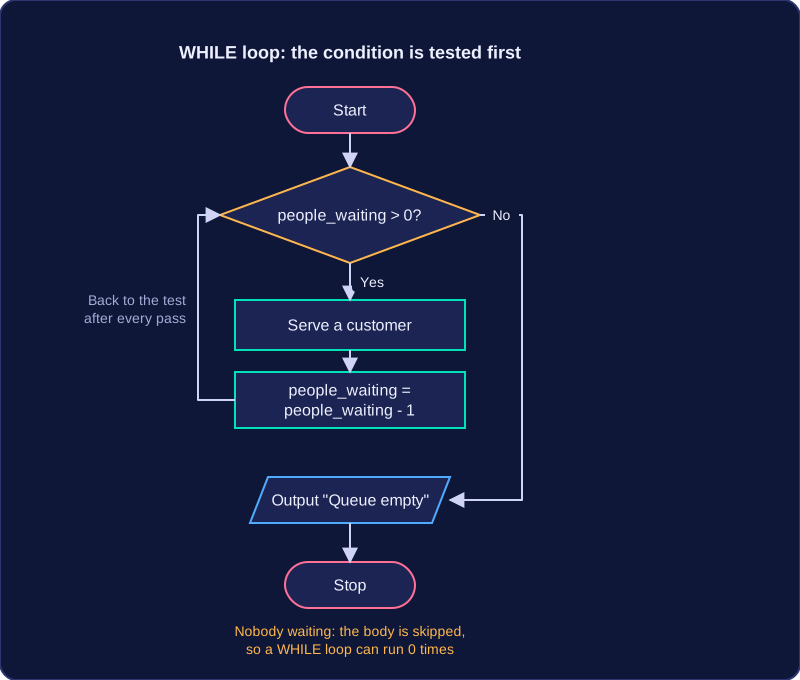
A loop in a flowchart shows a set of steps that repeats. You draw the repeated steps once, then add an arrow from a later symbol back up to an earlier one. That backward arrow is how a flowchart shows iteration.
A decision diamond tests the loop condition. One labelled exit takes the flow round the loop again; the other leaves it. Something inside the loop must change each time, otherwise the tested value stays the same, the same exit is always chosen and the flowchart never reaches Stop. That is an infinite loop.
Count-controlled loops
Use a count-controlled loop when you know the number of repeats in advance. A counter is initialised before the loop, tested by the decision and increased by a fixed step until it reaches a known end value. For example, to put six stickers on each box: set stickers to 0; test stickers < 6; if Yes, stick on a sticker and increase stickers by 1, then follow the arrow back to the test; if No, leave the loop. The sixth sticker makes stickers equal 6, so the No exit is taken and the loop ends.
Condition-controlled loops
A condition-controlled loop repeats until a condition is met, so the number of repeats is not known in advance. The decision tests the condition and an arrow returns to repeat the steps while it is not met. For example, a robot moves forward until its front sensor detects a wall: test wall detected; if No, move forward and follow the arrow back to the test; if Yes, leave the loop. Moving changes the sensor reading, so the condition can eventually become true.
Choosing the right loop
| Loop type | Use when | What ends it |
|---|---|---|
| Count-controlled | the number of repeats is known before the loop starts | the counter reaches its end value |
| Condition-controlled | the repeats depend on something happening | the tested condition becomes true |
In both types, check that the decision has two labelled exits and that the loop changes a value each time.
Nesting means putting one construct inside another — a decision inside a loop, or a loop inside a decision. Nothing extra is added to show nesting: it is shown by the arrangement of the symbols and the direction of the arrows.
How nesting is shown
A nested construct sits physically inside the shape of the other one. If a decision diamond sits inside the body of a loop — between where the loop starts and the arrow that leads back — that decision is inside the loop. If a loop's arrow starts and returns inside one exit of a decision, the loop exists only on that branch. You read nesting by tracing where the arrows go, so a flowchart needs no special symbol for it.
A decision inside a loop
Example: a snack machine keeps asking for an item code until the shopper presses cancel. Inside that loop, a diamond checks whether the code matches a stocked item and prints either "Dispensing" or "Unknown code". Because the diamond sits in the loop, it is reached and tested again on every pass, so it can give a different result each time as different codes are typed.
A loop inside a decision
Example: a car wash asks whether the driver wants the deluxe package. Only the "yes" exit contains a loop that keeps asking for extra wax coats until the driver answers no; the "no" exit goes straight to the wash. The loop runs on that branch alone — a driver who answers no never reaches it, and the decision itself is asked only once.
Nesting is what lets one flowchart show selection and iteration together, so a single diagram can describe a realistic algorithm rather than stopping after one construct.
A sub program symbol is a rectangle with an extra short vertical line just inside each of its sides. It means “run the named sub program at this point”, and the name written inside tells you which one to run.
A sub program is not drawn inside the main flowchart. It is drawn as its own separate flowchart. That flowchart begins with a terminal containing the sub program’s name and ends at a Stop terminal. For example, a main flowchart for a quiz game might have a sub program symbol labelled displayResult. The separate displayResult flowchart starts with a terminal reading displayResult, shows the score, then reaches Stop.
Using the symbol keeps a large flowchart manageable. You can break the algorithm into smaller, separate flowcharts, so each part is easier to design, read, test and understand. The main flowchart shows when the sub program runs; the sub program’s own flowchart shows what happens when it runs.
| Symbol | What it does | Where the steps are drawn |
|---|---|---|
| Process rectangle | Sets or changes a value | In the same flowchart |
| Sub program rectangle with side lines | Runs a named sub program | In its own separate flowchart |
The two are easy to mix up: a process rectangle sets or changes a value in the flowchart you are already reading, while a sub program symbol sends you to a different flowchart.
Interpreting a flowchart means following it from Start with the inputs you are given, writing down each value and output, and working out what the whole algorithm does.
Follow the arrows
Begin at the Start terminal and move along each arrow in turn. When you reach an input, use the value supplied. When you reach a process, carry out the change it describes. When you reach an output, record it. Keep going until you reach the Stop terminal.
Work out the purpose
To state a flowchart’s purpose, describe the overall task from its inputs, processes and outputs. For example, imagine a flowchart that inputs the number of lives a player has and sets a score to 0. A decision checks whether lives > 0: if true it adds 10 to the score and subtracts 1 from the lives, then loops back to the decision; if false it outputs the score. Its purpose is to award 10 points for each life lost until no lives remain.
Count loop passes
With 3 lives, the first pass makes the score 10 and the lives 2. The condition is still true, so follow the loop again: score 20, lives 1. Once more: score 30, lives 0. Now lives > 0 is false, so the loop ends and the output is 30. The loop ran three times. Do not stop after one pass; keep tracing until the decision actually sends you out of the loop.
Boundary values matter. If the decision were lives >= 0, a player starting with 3 lives would make a fourth pass, because lives equal to 0 would still be true.
A short flowchart and a Python program can describe the same algorithm. You can turn the flowchart into code step by step, and you can sketch a program as a flowchart using the same steps, decisions and loops.
Sequence and decisions
Steps that follow one another down the flowchart become statements written in the same order. An input/output parallelogram becomes input() or print(), and a process rectangle becomes an assignment. Keep the same variable names in both so you can match each symbol to its line of code.
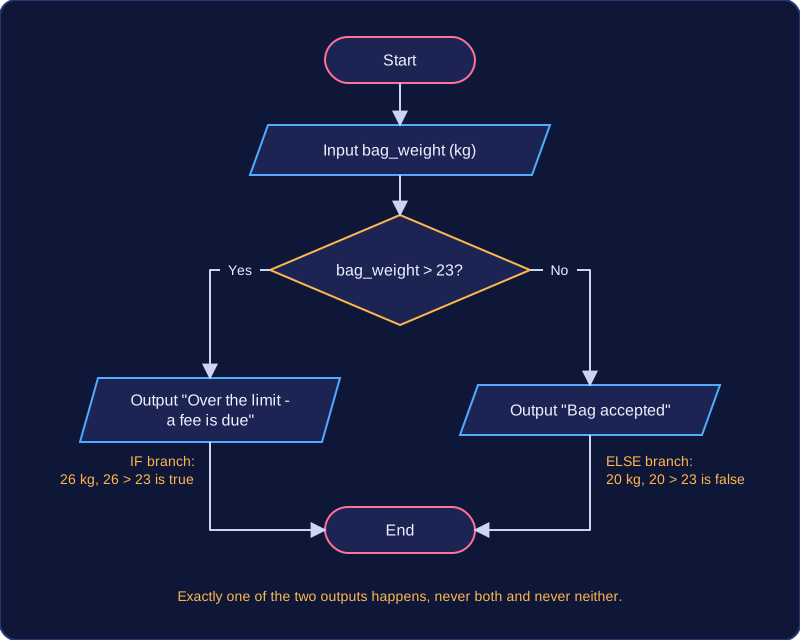
A decision diamond has two labelled exits, so it becomes an if statement: the “yes” exit is the if branch and the “no” exit is the else branch. Only one branch runs.
weight = float(input("Enter bag weight in kg: "))
if weight <= 10:
    print("Cabin bag allowed")
else:
    print("Check bag into the hold")
Output when the user types 7.5:
Enter bag weight in kg: 7.5
Cabin bag allowed
Here the input is stored in weight; the decision tests it against the 10 kg cabin limit, then each exit prints a different message.
Loop arrows
If a decision has an arrow back to an earlier step, that is a condition-controlled loop: the test happens again after each pass, so write it as a while loop. Something inside the loop must change the value being tested, otherwise the condition never becomes false.
raised = int(input("How much sponsorship have you collected? "))
while raised < 50:
    print("Keep collecting")
    raised = raised + int(input("More sponsor money: "))
print("Target reached")
Output when the user types 12, 20, 25:
How much sponsorship have you collected? 12
Keep collecting
More sponsor money: 20
Keep collecting
More sponsor money: 25
Target reached
The arrow back matches the while loop returning to its condition. Each pass adds to raised, so the condition eventually becomes false and the loop can end.
When a counter changes by a fixed step towards a known end value, the same idea becomes a count-controlled for loop with range(). For example, a counter that starts at 0, is tested to stay below 10 and goes up by 2 each time matches a for loop over range(0, 10, 2), which supplies 0, 2, 4, 6 and 8 in turn. Use while when you cannot tell in advance how many repeats are needed.