Revision notes
Forms of Notation

Contents
- Information flow diagrams
- Information flow diagram entities
- Information flow diagram arrows and labels
- Drawing information flow diagrams
- Interpreting information flow diagrams
- Completing information flow diagrams
- Tables
- Reading a table
- Tables and charts compared
- Written information
- Effective written information
- Executive summaries
- Reading written information
- Choosing tables or written information
An information flow diagram is a form of notation that shows how information is communicated from a source to a destination. It sets out two things: what information is sent, and who sends and receives it. Every act of communication in a scenario appears as a transfer from one participant to another, so the whole pattern of communication can be seen in one place.
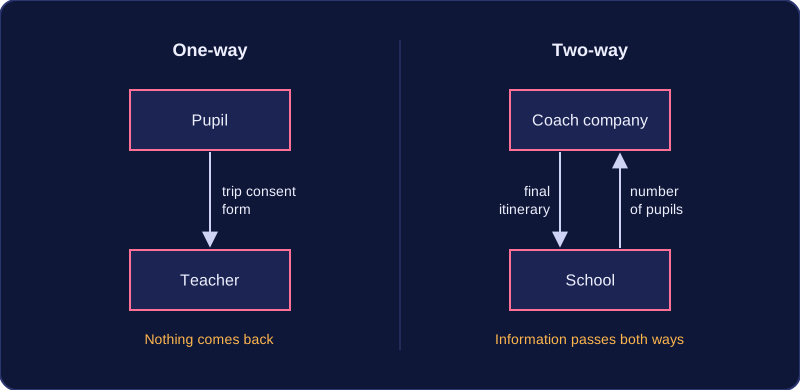
The diagram can show one-way communication, where information travels from a sender to a receiver and nothing comes back, or two-way communication, where information passes in both directions. The focus is on information rather than technology: it shows the information flowing through a system and what information the system uses at each point, so a reader can see which parts of the system rely on which pieces of information. For example, a coach company emails a school the final itinerary for a trip, and the school replies with the number of pupils travelling. That is one two-way exchange, and each arrow carries a label naming the actual information, such as 'final itinerary' or 'number of pupils', so there is no doubt about what is being passed on.
| Type of communication | What it shows | Example |
|---|---|---|
| One-way | Information travels from a sender to a receiver with nothing coming back. | A pupil sends a completed trip consent form to a teacher. |
| Two-way | Information passes in both directions. | A coach company emails a school the trip itinerary and the school replies with pupil numbers. |
Why organisations use them
Organisations use information flow diagrams to explain their systems, data and information to staff, managers, clients and new employees. A diagram should be designed so that it is easier to read than a text description of the same information. The reader should see the whole pattern of transfers at a glance instead of working through paragraphs to find out who tells whom what. This makes it quick to check that every necessary communication is shown, and it gives everyone the same clear picture of how information moves through the organisation.
In an information flow diagram, every person, department or organisation that takes part is shown as an entity. Every participant named in a scenario must appear as an entity, so if a parent, a school office, a class teacher and a coach company all send or receive messages, all four are drawn. Leave one out and the reader cannot see who sends or receives part of the information.
The shape an entity takes
Draw each entity as a box, ellipse or circle and write its name inside it, such as parent, school office or coach company. Any of the three shapes is accepted, but keep to one of them for every entity so the reader can see at a glance that each shape of that kind is an entity.
Flowchart symbols are not appropriate. A process rectangle, a decision diamond, an input/output parallelogram or a terminator each means something particular in a flowchart, and none of them means “entity”. An information flow diagram uses entities joined by labelled, directed arrows, so it never borrows the process and data-store notation of a data flow diagram.
A department is still an entity
A department carries out work, but the diagram shows only what information it sends and receives, not the tasks it performs. A reception desk that books appointments is drawn as a single entity named reception, not as a process; the booking activity does not appear at all. A department is drawn exactly like a person or an outside organisation.
An information flow diagram shows each transfer of information as a single arrow, called a flow line. The arrow carries one piece of information from one entity to another, and its label says what that information is.
One arrow for each transfer
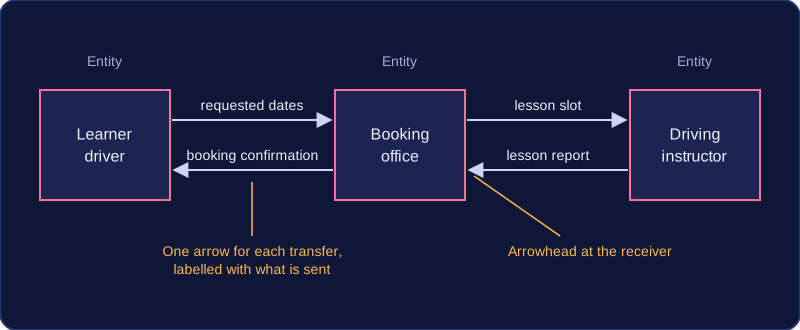
Each separate transfer gets its own flow line. If a scenario describes three transfers, the drawing needs three arrows. Merging them into one arrow loses the detail the diagram exists to show, because nobody can then tell who sends what to whom.
Where information passes in both directions between the same two entities, draw an arrow each way. Each direction usually carries different information, so each arrow needs its own label.
Arrowheads give the direction
Every flow line has an arrowhead. The tail of the arrow touches the sender and the head touches the receiver, so the arrowhead always points at whoever receives the information.
Direction changes meaning. An arrow from a player to a coach labelled 'signed medical form' says something completely different once reversed, because then the coach would be the one sending the form. Keep the sender on the tail and the receiver on the head.
Labels name the information
Write on each arrow the specific information being transferred, naming the document or the details, such as match registration or weekly takings. A vague label like 'information' or 'data' tells you nothing about what is sent, so it does not show the flow properly. Different wording is fine as long as it means the same information.
Worked example: a player hands a coach a signed medical form, the coach sends the squad list to the club secretary, and the secretary sends the match registration to the league organiser. That is three transfers, so it needs three arrows, each labelled with the item being sent and pointing from the sender to the receiver.
An information flow diagram is drawn from a written scenario, so the scenario is the only source: everything it describes should appear, and nothing it does not describe should creep in.
The method
- Read the scenario and list every person, department or organisation that sends or receives information. Each one is an entity.
- Draw each entity as a box, ellipse or circle, with its name written inside the shape.
- For each separate transfer, draw one flow line from the sender to the receiver, with the arrowhead at the receiver's end.
- Label every arrow with the specific information carried.
- Re-read the scenario and check that every step is represented by an entity or an arrow, and add anything you have missed.
For example, a scenario about booking a driving lesson might name a learner driver, a booking office and a driving instructor. Listed as transfers it reads: the learner sends requested dates to the office; the office sends a booking confirmation to the learner; the office sends the lesson slot to the instructor; the instructor sends a lesson report to the office. Four transfers means four labelled arrows, not one arrow labelled booking, which would lose three of them.
What a correct diagram needs
A correct diagram has three features. The notation must be right: entity shapes joined by labelled arrows, never flowchart symbols. The connections and directions must be right: each arrow starts at the sender, finishes at the receiver and points the right way. And the coverage must be complete: every information flow the scenario describes appears. A diagram that misses a transfer, reverses an arrow or leaves a label off is incomplete, even if the rest of it is neatly drawn.
Drawing the diagram is an early step in designing a system. Settling who sends what to whom first means the later decisions, such as what data has to be kept and which technologies will carry it, are based on the information that genuinely has to move rather than on guesses.
Interpreting an information flow diagram means turning the picture back into sentences: who sends what, and to whom. Work through the diagram in three steps, and nothing in it gets missed.
Working through it in three steps
- Identify each entity. List every person, department or organisation shown. A diagram of a gym might contain three: the member, the reception desk and the fitness instructor.
- Follow each arrow. Note the entity at the tail, which is the sender, and the entity at the head, which receives it. Direction carries meaning: an arrow from the reception desk to the instructor says something different from one pointing the other way.
- Read each label. The label names the specific information carried, such as 'membership renewal request' rather than the vague 'details'.
Writing it out in words
Put the three steps together and each arrow becomes a sentence of the form 'the sender sends the information to the receiver'. For the gym diagram: the member sends a membership renewal request to the reception desk; the reception desk sends the updated class booking list to the fitness instructor; the instructor sends the weekly training plan back to the member. Naming the sender and receiver of every arrow is what makes the description precise — writing that information 'passes to the next stage' does not say who sent what.
Describe only what is there. If you add a processing step or a store of data, you have started describing something else, because those belong to a data flow diagram.
When the organisation is unfamiliar
A diagram may show an organisation you have never met, such as a ticket office or a research laboratory. You do not need to know how it works: the entity names and the pattern of labelled arrows tell you how that part of it communicates, and that is enough to describe every flow confidently.
A completion question gives you a partly drawn information flow diagram alongside a description of a system, and asks you to work out what is missing so the diagram matches the description exactly. In a text answer, you name each missing item and say where it belongs. Anything absent or wrong can be the thing you need to supply.
What might be missing
- An entity — a person, department or organisation in the scenario that has not been drawn yet.
- A flow line — a transfer the description mentions but the diagram does not show.
- An arrowhead — a line drawn with no direction, or one pointing towards the sender instead of the receiver.
- An arrow label — a label that has been left off, or one so vague that the reader cannot tell what is being sent.
Compare the description with the diagram
Read the description once and write two lists: every entity it names, and every transfer it describes (who sends what to whom). Then work through the diagram and tick off each entity and each transfer you can find. Whatever is still unticked is what you must supply.
For example, a description of a veterinary practice names the pet owner, the receptionist, the vet and the laboratory. The pet owner passes the pet's symptoms to the receptionist, who sends appointment details to the vet. The vet sends a test request to the laboratory, the laboratory returns the test results, and the vet sends a treatment plan back to the pet owner. If the diagram already shows the symptom and appointment arrows but has an unlabelled arrow from the laboratory to the vet, you supply the label test results. If no arrow leaves the vet for the pet owner, you say that an arrow from the vet to the pet owner is needed, labelled treatment plan.
Check each transfer
For every arrow you identify as missing or incorrect, confirm its tail sits at the sender and its head at the receiver, and that its label names the specific information carried — not just 'information'. Where the description shows information passing both ways, check that an arrow for each direction has been drawn, since each usually carries something different. Finally, remember the diagram should contain nothing the description does not mention, so do not invent extra entities or transfers.
A table presents data and information in rows and columns. The space where a row and a column meet is a cell, and each cell holds one item of data. Because every value sits in a known place, a reader can find one value fast or compare a whole set, which makes a table quick to read and to analyse.
Organisations use tables wherever people need to look things up and compare them: a café price list, a staff rota, a stock record, a bus timetable or a month of sales figures. Written out in sentences, the same figures are hard to scan and easy to misread. A table lines them up, so one item is read across a row while the same field is compared down a column.
What makes a table clear
Every clear table starts with a title that says what the table shows and gives the context, such as the place or the time period. The row headings then name what each row is and the column headings name each field, so no reader has to guess what a cell means.
Café price list, summer 2026
| Drink | Small (£) | Regular (£) | Large (£) |
|---|---|---|---|
| Coffee | 2.20 | 2.60 | 3.00 |
| Hot chocolate | 2.40 | 2.80 | 3.20 |
| Tea | 1.80 | 2.10 | 2.40 |
Units go in the headings rather than beside every value: here each price column says (£), so no one confuses pounds with pence. The units stay the same all the way down, and every value in a column is the same kind of thing, so columns can be compared safely.
Ordering and summarising
Tables are organised logically. Related data is grouped together, rows are sorted into a sensible order — the drinks in the price list are alphabetical, though a stock list might be sorted by quantity so low items show first — and a totals row is added where it helps the reader. A total at the foot of a sales table gives the month's income at a glance, saving the reader from adding up the column and making a mistake.
Reading a table means using its title, headings and units to find and interpret specific values. The title tells you what the table is about: the organisation, the data and the time period. The table below is titled Oakfield School charity fun run, money raised in May, so you know it shows one school's fundraising during one month.
| Class | Sponsor money (£) | Donations (£) | Total raised (£) |
|---|---|---|---|
| 8A | 120 | 45 | 165 |
| 8B | 95 | 60 | 155 |
| Total | 215 | 105 | 320 |
Finding one value
The row headings name each item, such as a class, and the column headings name each field, such as sponsor money or donations. To read a value, find the row for the item and the column for the field, then read the cell where they meet. Here, the donations for class 8B sit in the 8B row and the Donations (£) column, so the value is £60. Without the headings, 60 could mean anything.
Units and comparisons
Always check the units, because they change what a number means: 60 in a column headed Donations (£) is £60, but 60 in a column headed Mass (kg) is 60 kg. To compare values, compare cells in the same column; 8B received £60 in donations and 8A received £45, so 8B received £15 more. Use a total row to check that a column adds up: £120 + £95 = £215. Missing entries, mixed units and vague headings such as “Amount” make a table hard to read accurately, because you cannot tell what the numbers represent or compare them fairly.
A table lists values in cells arranged in rows and columns. A chart draws those values as bars, lines or slices. They can present the same data, but they are not the same form of notation.
When each works best
Charts and graphs are better than tables for showing trends and patterns quickly. If you want to see whether something is rising, falling or repeating, a line graph or bar chart lets your eye follow the shape at once. For example, a line graph of a school's weekly recycling weight makes a steady rise easy to spot.
A table can hold far more detail than a chart of the same data. Extra columns can record cost, quantity, category or a date, so a reader can find exact values rather than estimate from a bar. Tables may be preferred where precision is essential, because every exact value is visible and can be checked.
| Feature | Table | Chart |
|---|---|---|
| Main strength | Exact detail and many columns | Quick trends and patterns |
| Shows exact values | Yes, every cell is visible | Harder to read exact values |
| Risk of misleading | Lower if headings and units are clear | Higher if the axis scale is altered |
Charts can mislead
A chart can mislead if its axis scale is altered, because a scale that does not start at zero makes a small change look dramatic. Pictures scaled in two directions mislead as well. If a pictogram draws a value of 10 as a 2 cm by 2 cm picture and a value of 20 as a 4 cm by 4 cm picture, the second picture has four times the area, so it looks four times as big even though the value is only doubled. A table of the same figures would avoid that impression.
Organisations often use a chart to show the pattern and a table underneath to give the exact figures, so the reader gets both the quick view and the precise detail.
Written information explains systems, data and information in sentences and paragraphs rather than in cells. Organisations use it alongside tables and charts to describe how something works and why the figures matter. It is not just any text: it is written to help a particular reader understand a system or a set of figures.
Documenting a system
When an organisation records how a system works, written information sets out what a table cannot: who uses the system, what each piece of data is for and the order in which things happen. For example, a youth club might keep a table of its equipment loans, then add a paragraph explaining that the code in each row is the borrower's membership number and that returned items are marked with a date. A new volunteer can read this and use the system correctly.
Written information can be as short as one explanatory sentence or as long as a full report or user guide. The right length depends on how much explanation the reader needs.
Giving figures meaning
A table shows the figures and a chart can show the pattern, but neither can say why the pattern happened. A short text description under a table or chart gives it context. Suppose a bike workshop's table shows repairs rising from 18 in week 1 to 41 in week 4. A chart makes the rise easy to see, yet only a sentence underneath can tell you that a new cycle path opened in week 3 and brought more customers. The numbers and the explanation work together; written information does not replace the table.
Effective written information is text that a reader can understand and use straight away. It is clear, accurate, concise and written for its intended audience, so it does the job without making the reader work hard to find the point.
Clear and accurate
Accurate written information has facts and figures that are correct and consistent with any tables it refers to. If a report says the oldest item in stock is a batch of 40 cables, the stock table must show the same number. Wrong figures destroy trust and can lead to poor decisions.
Concise means including only what the reader needs. A long document buries the main point, so short paragraphs and focused sentences are easier to act on. Length is not a sign of quality; padding wastes the reader's time.
Use correct terminology properly and consistently. Words such as backup, firewall and encryption have exact meanings, so use them the same way throughout. A backup is a copy of data kept so it can be restored; calling any saved file a backup confuses the reader.
Structure and audience
A logical structure helps readers follow the writing: headings show what each section covers, paragraphs group related sentences, and bullet points break a list of steps or features into easy pieces. A reader can then scan to the part they need.
Audience awareness means matching the language to the reader. For a client or a new member of staff, use plain words and explain any technical term the first time it appears. Use specialised terms only where the reader will understand them; a technician may know what a firewall does, but a new volunteer may not.
For example, a short guide for new club volunteers might say: "Before locking up, copy the register to the shared drive. This backup means the list can be restored if a laptop fails." It is brief, uses backup correctly, and explains why the step matters.
Written information can take the form of an executive summary: a short overview placed at the start of a report. It sums up the whole document for a reader who may not read the rest, so it must make sense on its own.
It is written for decision-makers, such as managers, who need the key points quickly. A busy reader should be able to understand the issue and decide what to do next without reading every page. It normally covers four things: the purpose of the report, the main findings, the conclusions and any recommendations.
For example, a report into why a school's online homework system keeps crashing might have an executive summary saying: the purpose was to investigate the crashes; the main finding was that most crashes happened when many classes logged on at 4pm; the conclusion was that the server cannot cope at peak times; and the recommendation was to move homework deadlines away from that time. That gives a manager the whole story in a few lines.
An executive summary is usually no longer than a page. It is written last, once the report is complete, because it can only summarise findings and conclusions that already exist.
Executive summary or introduction?
These two are easy to mix up. An introduction says what the report will cover. An executive summary gives the findings and conclusions themselves.
| Feature | Executive summary | Introduction |
|---|---|---|
| Position | At the start of the report | At the start of the report |
| Content | Purpose, main findings, conclusions, recommendations | What the report will cover |
| Read by | Decision-makers who may not read the rest | Readers starting the report |
| Length | Usually a page or less | Usually short |
| Written | Last, once the report is complete | Usually before the main body |
Interpreting written information means working out what the writer is actually telling you. You pick out the main points, the purpose and any instructions or conclusions, rather than reading every word at the same speed.
Purpose and main points
Purpose is why the piece was written: to inform, to instruct, to warn or to persuade. Knowing it helps you decide which parts matter most — in a warning notice, the part telling you what to avoid carries the weight.
Main points are the key facts and findings. They often sit in the first sentence of a paragraph, and headings let you jump straight to the section you need instead of working through everything.
Instructions and conclusions
Follow instructions in the order given, and watch for conditions — a step that applies only once the register has been signed changes both what you do and when. Conclusions and recommendations say what you should now think or do, so they usually come last and matter most.
Signpost words
Signpost words show how points connect, so one word can flip the meaning of a sentence.
| Signpost | What it signals |
|---|---|
| however | a contrast with what came before |
| therefore | a result or conclusion follows |
| as a result | cause and effect |
| for example | an illustration of the previous point |
| first, then, finally | the order of steps |
Take this notice: "The photography club moves to the art room from Thursday, which is a longer walk from the main gate. Therefore arrive by 3:10pm rather than 3:15pm so the register can be taken before the workshop starts. However, the door code stays the same. As a result of the move, there is no club on 14 March while the equipment is carried across." The purpose is to inform and instruct. The main points are the new room and the cancelled session; "however" tells you nothing else has changed; "as a result" links the move to the cancellation; and the conclusion is what you must now do — turn up five minutes earlier, and do not come on 14 March.
Organisations choose between a table and written information based on two things: the purpose of the communication (what the reader has to do with it) and the audience (what they already know and what they need from it).
When a table is the better choice
A table is better when exact values must be found or compared, especially when there are many of them. Lining figures up in rows and columns lets your eye travel down a column and spot differences straight away.
For example, a city bike-hire company lists its charges as a table: hire length down the side, customer type across the top. Someone planning a three-day visit can compare the adult, student and child prices in a few seconds. The same figures written out in sentences would be correct but slow to search through, and easy to misread.
When written information is the better choice
Written information is better when the reader needs explanation, reasoning or context rather than raw values. A couple of paragraphs can say why a rule exists, what happens in an unusual case, or what the reader should do next — none of which fits neatly into a cell.
The same bike-hire company would explain in writing that under-16s must have an adult sign for them, and why. No arrangement of numbers can carry that reasoning.
Using both, and reaching a judgement
The two forms work together: a report can contain a table of figures with paragraphs around it explaining what those figures mean. The table gives precision; the writing gives meaning.
A strong evaluation states your choice, gives reasons tied to purpose and audience, mentions a drawback of the form you rejected, and ends with a conclusion that follows from those points. For the bike-hire charges you might argue that a table is best because customers need to compare exact prices quickly, that writing the charges out would be slow to scan, but that a table alone cannot explain the age rule — so overall a table with a short written note beneath it serves the reader best.