Flowcharts
Flowcharts
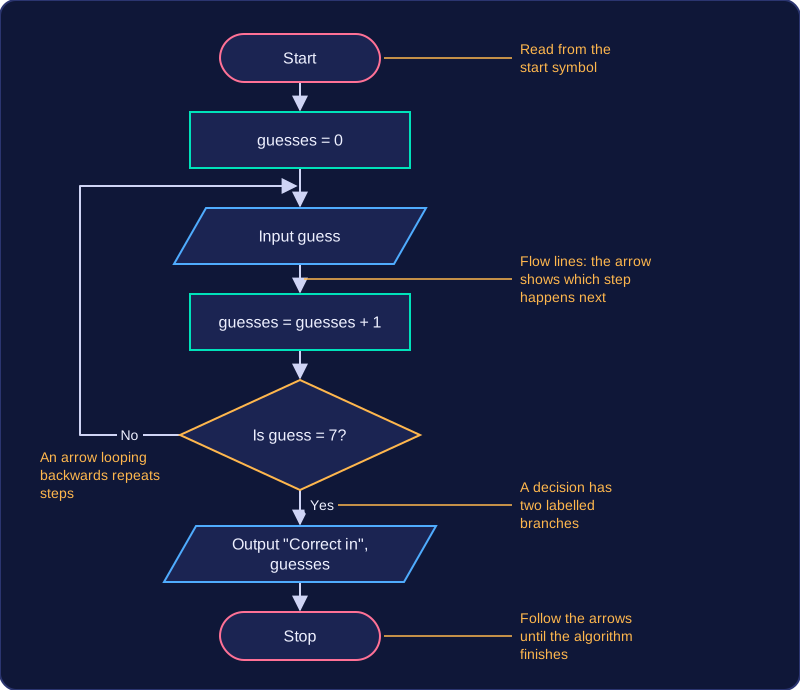
A flowchart is a graphical representation of an algorithm: standard symbols joined by flow lines that show the order in which the steps are carried out.
Each symbol stands for one kind of step and the arrows show which step happens next, so you read a flowchart from its start symbol and follow the arrows until the algorithm finishes.
Why plan with a flowchart?
Before you write program code, you need to be sure the steps are in the right order. A flowchart lets you design and check the logic on paper, where a forgotten step or a loop that never ends is easy to spot and cheap to fix. Because it is visual, the sequence of steps, the two branches at each decision and the arrows that loop backwards are easy to follow. Someone else can then check your plan without knowing a programming language, which makes a flowchart a good way to communicate an algorithm to a classmate, a teacher or a client before any code exists.
Where flowcharts struggle
For a long algorithm a flowchart grows quickly: lots of symbols, arrows crossing over each other, and a drawing that no longer fits on one page. Changing one step can mean redrawing a large part of the chart, and a crowded chart is slow to read. Pseudocode has nothing to redraw, so it can describe a complex algorithm in far fewer lines and is quicker to edit when the design changes.
One symbol, one meaning
The symbols are standard, so each one has a fixed meaning and they cannot be swapped around. A decision must be drawn as a decision rather than squeezed into a process box, because a reader relies on the shape to tell at a glance whether a step is an input, a process or a decision. Using the wrong shape therefore changes what the flowchart says the algorithm does.
| Feature | Flowchart | Pseudocode |
|---|---|---|
| Order of steps | shown by arrows you follow | shown by lines read top to bottom |
| Decisions and loops | stand out visually | shown with keywords and indentation |
| Small algorithm | clear and quick to read | clear and quick to read |
| Large, complex algorithm | becomes crowded and hard to edit | stays compact and easier to edit |
Practise this
Edexcel GCSE Computer Science · Flowcharts