Creating a Marketing Mix to Support a Product
The product lifecycle

Contents
The product lifecycle is a model showing how sales of a product change over time, from development through to decline. It helps a business work out where a product is in its life so that it can plan its marketing.
The five stages, in order, are development, introduction, growth, maturity and decline. Development comes first, before the product is launched, and decline is the final stage, so maturity is not the end of the lifecycle.
Sales pattern at each stage
| Stage | What happens to sales |
|---|---|
| Development | No sales yet, because the product has not been launched. |
| Introduction | Sales start low after launch. |
| Growth | Sales rise quickly as the product becomes more popular. |
| Maturity | Sales reach a peak or stay broadly steady. |
| Decline | Sales fall. |
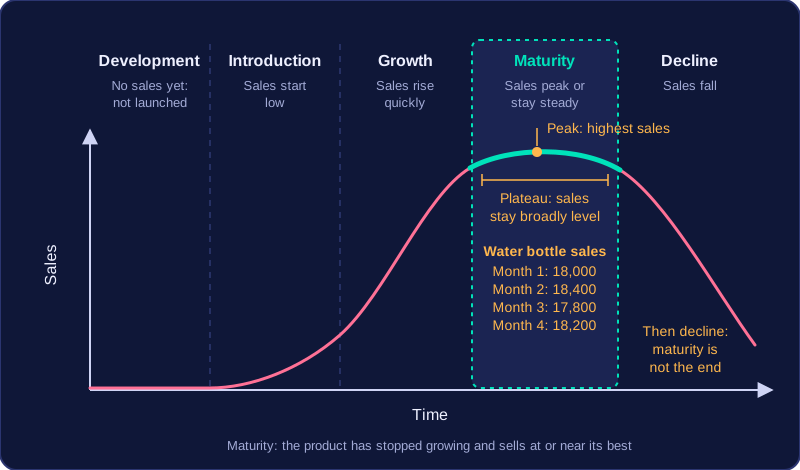
The lifecycle is usually shown as a sales-against-time graph. Time runs along the horizontal axis and sales along the vertical axis. The line starts at zero during development, rises through introduction and growth, levels off at maturity, then falls during decline. Each stage therefore has its own recognisable sales pattern.
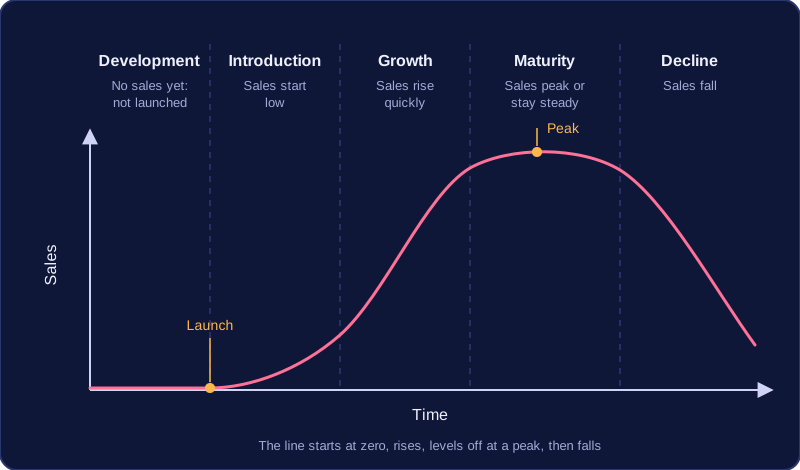
For example, imagine a new magnetic pencil case that clips inside a school locker. Before launch there are no sales while it is being designed. Just after launch only a few students buy one, so sales are low. Sales then climb quickly as word spreads. Once most students who want one have bought it, sales settle at a high, steady level. When a newer design appears, sales begin to fall.
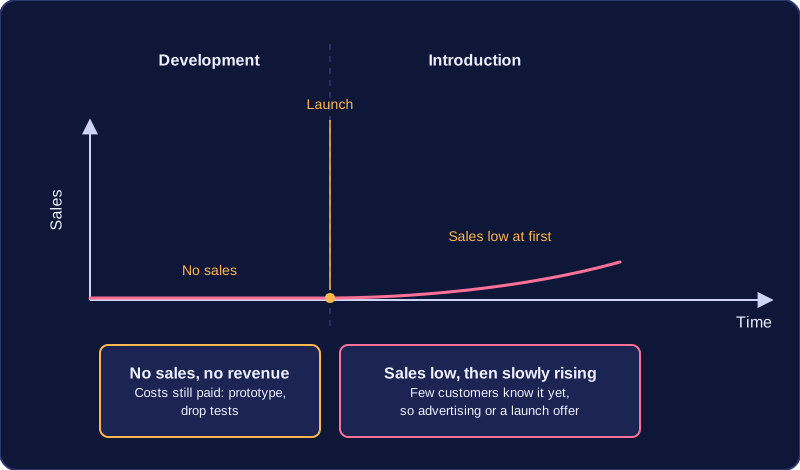
Development is the stage before a product is launched. The business is researching and testing the idea, so the product is not yet on sale. No sales are made and no sales revenue is earned. Development costs may still be incurred, such as paying for materials, prototypes or safety testing.
Introduction is the stage just after the product has been launched. Sales are low at first because customers do not know about it yet. Marketing activity may begin to build awareness, such as advertising or a launch offer. Development comes before the launch; introduction comes after it.
Telling them apart
| Stage | Sales | Typical activity |
|---|---|---|
| Development | None, because the product is not on sale | Researching, testing and preparing the product; costs may be incurred |
| Introduction | Low, because the product has just launched | Marketing may start to attract the first customers |
For example, a business designing a new lunchbox might pay for a prototype and drop tests during development, with no sales. When the lunchbox launches, only a few customers buy it at first, so sales stay low while the business advertises it. If a product has not yet gone on sale and has made no sales, it is in development; if it has just launched and only a few customers are buying, it is in introduction.
Growth is the stage of the product lifecycle when sales rise rapidly because the product becomes more popular and more customers buy it. Each month or year brings a noticeably bigger number of sales than the one before, so sales climb quickly rather than creeping up.
A rapid climb from a low level is the clue that a product is in growth. For example, a small business selling a new type of insulated lunch bag might sell 400 in its first month, then 1,100 the next month and 3,200 the month after. The totals are still modest, but the steep upward trend shows the product is in growth: more customers are choosing it each month.
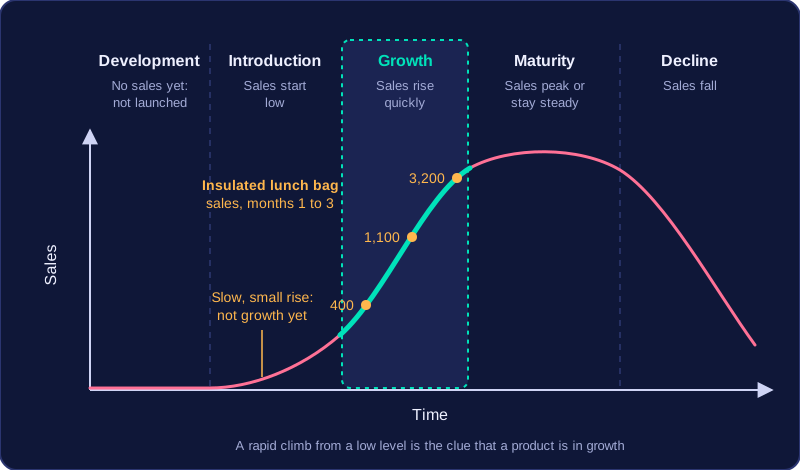
A slow, small increase is not enough on its own. Growth means a rapid rise as the product becomes more popular, so sales that edge up only a little do not show real growth.
Maturity is the stage of the product lifecycle when a product is at its most popular. Sales are at their highest level — the peak — and stay broadly level rather than climbing quickly or falling away. This levelling-off is sometimes called a plateau.
Spotting maturity in sales figures
Sales that are at their highest and broadly stable point to maturity. For example, a small business selling a reusable water bottle might record 18,000 sales in one month, then 18,400, then 17,800 and then 18,200. Sales are high and hovering around the same level, so the product looks mature. If sales were still rising sharply, it would not yet be maturity.
The length of maturity varies a lot. A classic family board game can stay at a steady peak for many years, while a novelty phone case might hold its peak for only a few months before interest fades.
Maturity is not the last stage
It is easy to assume maturity is the end, but decline follows it. In decline, sales fall. Maturity simply means the product has stopped growing and is selling at or near its best; it does not mean the product has stopped selling altogether.
Decline is the stage when a product's sales fall. The fall is judged from an earlier high, so a business looks at the trend over several months or years rather than one low sales figure. For example, a company selling a board game may have sold 20,000 copies a year at its best, then 14,000, then 9,000. That pattern of falling sales shows the product is in decline.
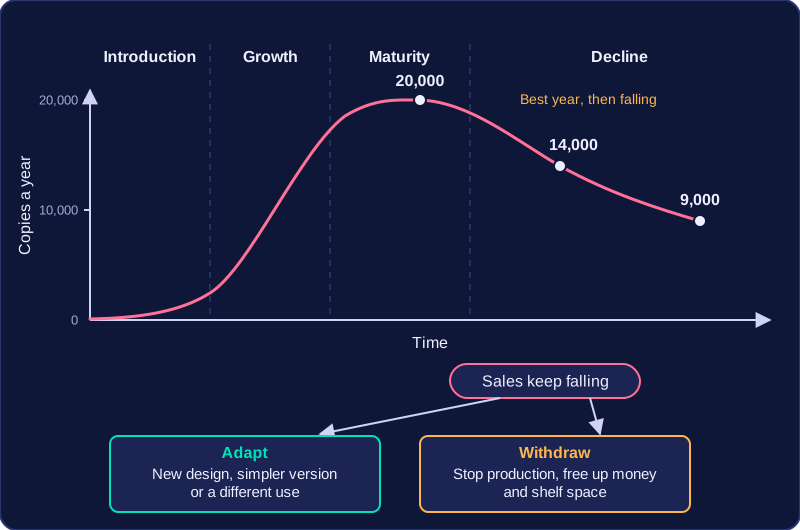
When sales fall, the business can adapt the product or withdraw it. Adapting means changing something about the product to make it appeal again, such as a new design, a simpler version or a different use. Withdrawing means stopping production and taking the product off the market, which can free up money and shelf space for other products. A business might withdraw a product if sales are low and it thinks adapting will not work.
Decline does not always mean immediate withdrawal. A product may keep selling while sales fall, perhaps to loyal customers, and it may still make some profit. A business may also adapt the product and continue selling it. Withdrawal is a decision the business makes; it is not automatic as soon as sales start to fall.
To judge the most likely stage of the product lifecycle, use the pattern in sales figures over several periods. One sales figure on its own tells you very little: a high number could be a peak, or it could be part of a steep climb. The trend is the overall movement across the data, and that is what points to a stage.
Read the level and direction
Describe two things about the figures. The level is how high sales are, such as zero, low, high or peak. The direction is whether sales are rising, flat or falling. Then match the combination to the stage that fits best.
| Sales evidence over time | Most likely stage | Justification |
|---|---|---|
| No sales in early months, then low sales after launch | Development, then introduction | Zero sales means not launched; low sales just after launch fit introduction. |
| Low sales rising quickly month after month | Growth | The direction is a rapid rise, so demand is taking off. |
| Sales reach a high level and stay close to it | Maturity | The level is peaking and the direction is roughly flat. |
| Sales fall across several periods | Decline | The direction is consistently downwards. |
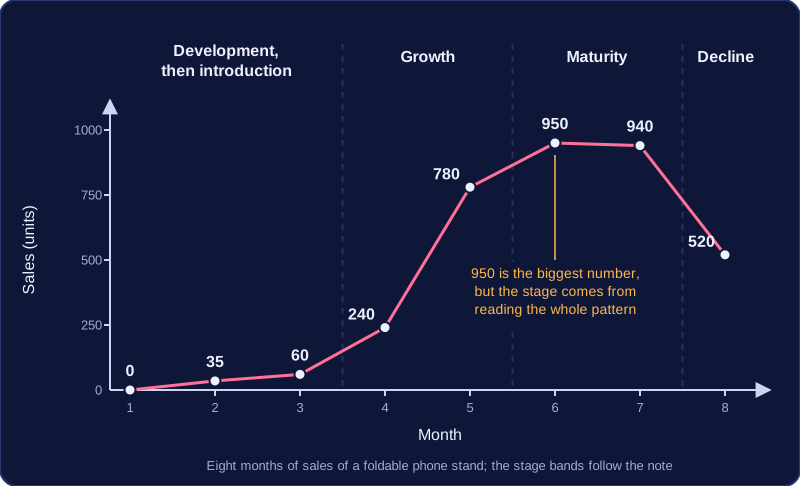
For example, a business selling a foldable phone stand records monthly sales of 0, 35, 60, 240, 780, 950, 940 and 520. The trend is no sales, then low sales, then a fast rise, then a high and almost flat level, then a fall. The best answer is not “maturity” just because 950 is the biggest number: read the whole pattern. The early low figures point to introduction, the fast climb to growth, the near-flat high figures to maturity and the final fall to decline. Justify your answer with the figures: “Sales rose from 60 to 780 in two months, so the product is likely in growth.”