Business Operations
Bar gate stock graphs

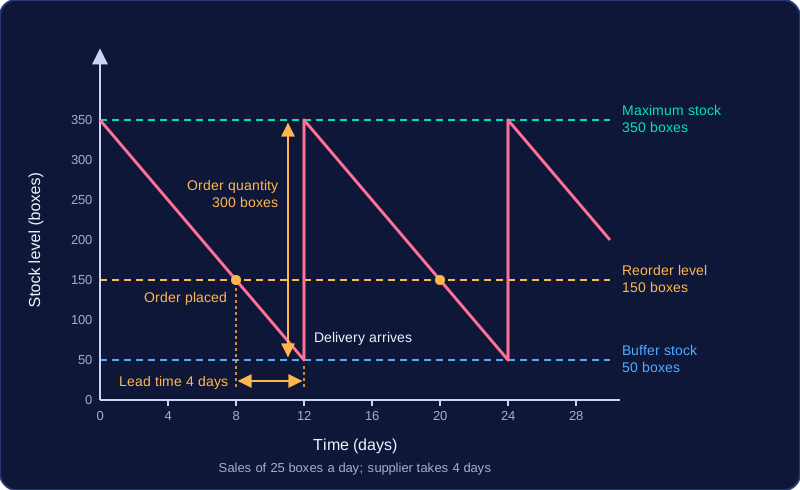
A bar gate stock graph shows how a business's stock level changes over time. Time runs along the bottom and stock level up the side. The line slopes down as stock is used or sold and jumps straight up when a delivery arrives, making a shape a little like a gate.
Reading the levels
- Maximum stock level: the most stock the business plans to hold, shown by the top of the vertical rise.
- Buffer stock (minimum stock level): emergency stock kept so the business does not run out. It is the level stock should not normally fall below.
- Reorder level: the stock level that triggers a new order. It must be set high enough that the delivery arrives before buffer stock is used.
- Lead time: the time from placing an order to receiving the delivery. On the graph it is the horizontal gap between reaching the reorder level and the vertical rise.
- Order quantity: the amount ordered, shown by the size of the vertical rise.
For example, a craft shop sells 25 boxes of card a day. It holds a maximum of 350 boxes, reorders at 150 boxes and keeps 50 boxes as buffer stock. Its supplier takes 4 days. When stock reaches 150, four days of sales use 100 boxes, so stock falls to 50 just as the delivery arrives. The shop orders 300 boxes, so the delivery raises stock back to its maximum of 350.
What it can show
A bar gate graph helps a business judge whether its reorder level and buffer stock are sensible. If no further delivery arrives, you can follow the downward slope to see when stock will run out. The graph usually assumes stock is used at a steady rate and deliveries arrive instantly. Real sales can be uneven and deliveries can be late, so the actual stock line may not be as neat.
Practise this
Edexcel GCSE Business · 2.3.2 Working with suppliers