Algorithms
Structure Diagrams

Contents
A structure diagram shows a problem that has been broken down into smaller parts. The whole problem sits in a single box at the top, and everything it is made of sits on the levels underneath.
The levels
Each level below the top box holds the subsections of the box directly above it. Any subsection can be broken down again, so the level below that holds its smaller tasks. This carries on until every box is small enough to be written as one sub program or just a few lines of code.
| Position | What it holds |
|---|---|
| Top box | The whole problem |
| Next level down | The main subsections the problem is made of |
| Levels below that | Smaller and smaller tasks belonging to the box above |
The top box is the whole problem, not the first step the program carries out. Nothing here says what happens first, because that is not what the diagram is for.
Lines and links
Boxes are rectangles joined by straight lines, so the shape widens towards the bottom. A line means the lower box is part of the box it is joined to. Boxes are joined only to their parent, never across to each other, so every task can be traced back up to the problem it belongs to.
For example, a program that waters a greenhouse could have Water the plants in the top box. Joined to it on the level below sit Check how dry the soil is and Give the plants a drink. Give the plants a drink is broken down once more, giving Open the valve, Wait 30 seconds and Close the valve on the next level, each joined only to Give the plants a drink.
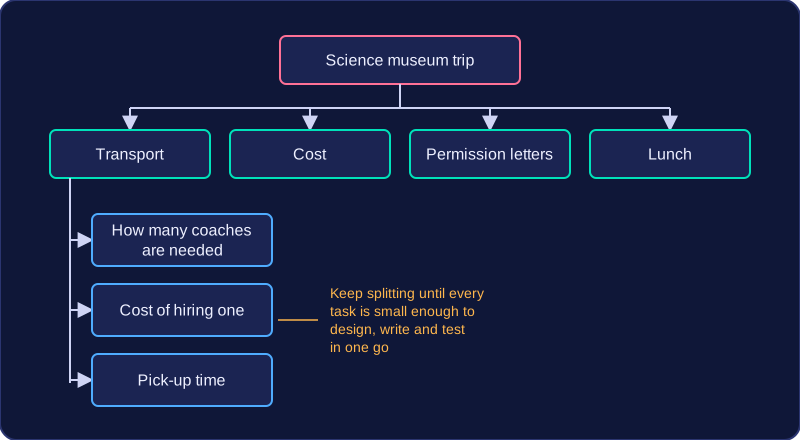
A structure diagram is only useful if someone else can follow it, and that depends on how you label and arrange the boxes. Each box holds a short description of the task it represents, and boxes that sit on the same level are placed in a sensible order.
Naming each box
Keep every label to a few words and try to begin it with a verb, so the box says what is done rather than what something is. Calculate delivery cost tells a reader far more than delivery, and Print address label is clearer than a full sentence such as this is where the label gets printed out at the end. Vague single words like data or output could mean almost anything, and sentence-length labels are slow to read, so aim for the middle: short, but specific about the action.
Ordering boxes across a level
Boxes on the same level are laid out from left to right in the order the tasks are carried out. Under a box called Post a parcel, for example, you might read across: Weigh parcel, Print postage, Attach label. Reading across a level therefore tells you the running order of that part of the job, which makes the diagram predictable to follow. Boxes on a level are not joined to each other, though — each one connects only upwards to its parent box, with the left-to-right position carrying the order.
When a box needs nothing below it
A box may have nothing beneath it when its task is already small enough to be carried out in a single go. For a box called Weigh parcel, you could add Place on scale and Note the weight below it, while Print postage could sit with nothing underneath, because printing the postage is a single step — splitting it further would add boxes without adding meaning. So branches of the same diagram can stop at different depths: there is no rule that every branch must reach the same level.
To draw a structure diagram, you record the problem's decomposition level by level, from the whole job down: the whole job in the top box, its main subsections underneath, then each subsection split into its own smaller tasks until every box is a single small task.
- Start with the whole problem. The top box names the complete job, not the first step. For a program that plans transport for a school trip, the top box would read Plan buses for a school trip.
- Add the main subsections. Give each big job its own box and join it with a line to the top box. Between them they must do everything the top box promises: Count people going, Find seats per bus and Work out buses needed.
- Break each subsection down in the same way. Treat a subsection as a small problem and add its tasks on the next level, each joined to that subsection alone. Count people going becomes Ask each class for its number and Add the class numbers; Work out buses needed becomes Divide people by seats per bus and Round up to a whole bus.
- Stop at a single small task. If a box already describes one small task that needs no further splitting, it needs nothing below it, so different branches can end at different depths.
Work in passes rather than filling in every level at once: draw the top two levels, check the subsections cover the whole problem with nothing missing or spare, then push down one branch at a time. Keep each box joined only to the box directly above it, so tasks stay grouped under the subsection they belong to instead of being strung out as a line of steps.
Completing a partly drawn structure diagram means filling in boxes that should be there but are not yet drawn. You look at a box, ask what jobs the thing it describes is made of, and add any missing part on the level below it, joined to its parent.
Suppose the top box of a school trip system reads Book the school trip, and only its first two subsections are shown: Choose a destination and Collect consent forms. A trip cannot go ahead without transport, so Arrange transport has to be added on the same level as those subsections. Putting it underneath Collect consent forms would say something different and wrong about how the system is built, which is why the level matters as much as the box itself.
Refining a diagram
Refining is improving a diagram that already exists, and there are three ways to do it:
- Break a box that still describes too much into smaller boxes underneath it. Collect consent forms is really several jobs, so it gains Print the letters, Hand out the letters and Chase up missing replies.
- Add a subsection that was missed altogether, such as Send confirmation as another main subsection under the top box.
- Add detail inside a subsection further down, for example placing Email the tickets under Send confirmation, so extra detail is added below the top level too.
A box that already holds one small task needs nothing underneath it, so refining does not mean dragging every branch down to the same depth.
Reading a structure diagram means explaining, for each box, what that part of the problem does and which smaller tasks it is made of, then following the lines to see how the parts depend on each other. The diagram is a record of how the problem was broken apart, so reading it back is how you check the split makes sense.
What each box does
Each box is a task, named with a short phrase such as Book in the bike or Take payment. Everything below a box is the set of smaller tasks that box is made of, so you read a branch downwards: the parent job is carried out by doing the tasks beneath it.
For example, the top box Process a bike repair has three subsections: Book in the bike, Carry out the repair and Take payment. Under Carry out the repair sit three smaller tasks: Find the fault, Fit new parts and Test the brakes and gears. Reading those three tells you what Carry out the repair actually involves, which the single box on its own does not.
How the subsections link
Lines join a box only to its parent above, and they mean is part of, not happens next. The other thing to read is the flow of results: often one subsection produces something that another one needs.
| Box | What it does | Link to another subsection |
|---|---|---|
| Find the fault | Inspects the bike and lists the broken parts | Its list is needed by Fit new parts |
| Fit new parts | Replaces the listed parts | The parts and their prices are needed by Take payment |
| Test the brakes and gears | Checks the repair is safe | Its pass or fail result decides whether the bike is handed back |
Fit new parts cannot be understood on its own: which parts get fitted depends on the list made in Find the fault. Spotting that dependency is the point of reading the diagram, because those two subsections then have to be planned and tested as a pair.
A structure diagram is a planning tool that shows how a problem has been decomposed into smaller parts. Its main benefit is that the whole problem and its subsections sit in one view, so everyone working on the solution can see what must be produced and how each section links to the rest.
Sharing and testing the work
Because each box represents a separate task, the work can be divided between programmers. One programmer might take the subsection that handles customer details, while another takes the subsection that works out totals. Each box can become a sub program, so the parts can be built separately. This also means each part can be tested separately before everything is combined, which makes faults easier to find.
Spotting repeated tasks
Repeated tasks are easy to spot when the same small task appears under more than one subsection. For example, a structure diagram for a school charity fair might show a task to record a payment under both the cake stall and the book stall. You can then write that task once as a single sub program and reuse it, saving time and keeping the code consistent.
Planning before code
Structure diagrams help you map out a program before you write any code. You can check that every subsection has been included and that nothing important has been missed. If a box is still too large, you can break it down further before you start coding, which is much cheaper than discovering the gap later.
A structure diagram records how a problem is divided into parts and how those parts link together. Lines join a subsection to the part it belongs to, so the diagram shows the structure of the problem. It does not show the order of every step in a process, or any decisions made along the way.
A flowchart does a different job. It shows the steps of a process in the order they happen, including decisions and loops. For example, a flowchart for checking library books might scan a book, compare its due date with today's date, branch Yes or No depending on whether it is overdue, then loop back to scan the next book. Decisions and loops are both features of a flowchart.
This is why a structure diagram has no decision shapes, no Yes/No branches and no loop-back arrows. A decision shape that asks a question and splits into two paths belongs to a flowchart, as does an arrow returning to an earlier step. Adding either to a structure diagram mixes up two different tools: one shows the parts of a problem, the other shows the order of a process.
| Structure diagram | Flowchart | |
|---|---|---|
| Main job | Shows the problem's parts and how they link | Shows the steps of a process in order |
| Decisions | No decision shapes and no Yes/No branches | Uses decisions with Yes/No branches |
| Loops | No arrows looping back | Can loop back to repeat steps |
If you were planning a school science fair, the structure diagram could show Build stands and Label exhibits under Set up venue; those lines tell you where each task belongs. It would not show a decision about whether it is raining or a loop for greeting each visitor in turn. Those are details of a process, so they belong in a flowchart.