Trace Tables
Trace Tables

A trace table is a table that records the values held by variables as an algorithm is executed step by step. You fill it in as you work through the statements, so at the end it shows exactly how every value changed and what the algorithm produced.
Setting out the columns
Give each variable its own column, usually in the order the variables first appear, so the table matches the order you meet them in the algorithm. Add an output column for anything the algorithm displays, plus a column for a condition where checking it helps you decide which branch runs or when a loop should stop.
Each row records the state after one step or one iteration. Only fill in the output column when an output statement actually runs. You can leave a variable cell blank when its value does not change — a blank means the earlier value carries forward, not zero.
Worked example
This program gives 5 points for every even level:
points = 0
for level in range(1, 5):
    if level % 2 == 0:
        points = points + 5
print(points)
Output:
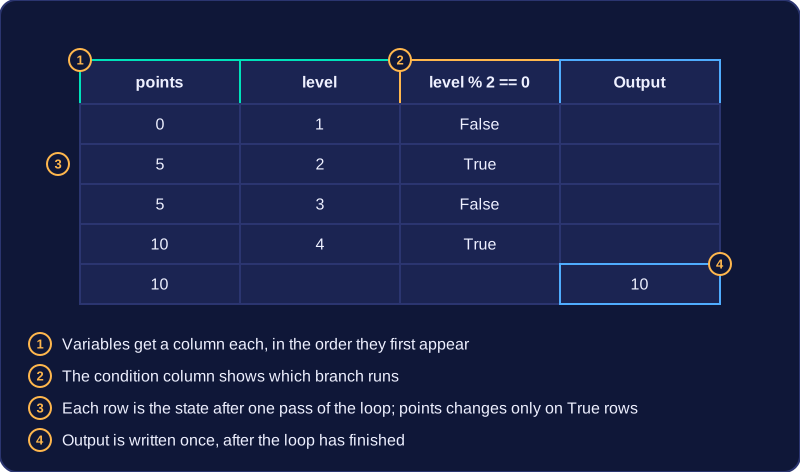
10points is given a value before level appears, so it takes the first column:
| points | level | level % 2 == 0 | Output |
|---|---|---|---|
| 0 | 1 | False | |
| 5 | 2 | True | |
| 5 | 3 | False | |
| 10 | 4 | True | |
| 10 | 10 |
The condition column explains why only levels 2 and 4 add points, while the odd levels leave the total alone. The output is only written once the loop has finished, so it sits in its own final row.
Layouts vary
Some trace tables put the condition before the variable columns, some finish with a separate output row, and some hand you spare rows underneath. Any of these is acceptable as long as the values and the order of execution are clear, so spare rows left blank cost you nothing. You can also record one row per statement instead of one per iteration, provided you keep the same pattern all the way down.
Practise this
Edexcel GCSE Computer Science · Trace Tables
Edexcel GCSE Computer Science · Errors in algorithms
Edexcel GCSE Computer Science · Syntax and Logical Errors