Abstraction and Decomposition
Structure Diagrams

A structure diagram shows how a problem has been broken down, or decomposed, into smaller subtasks. The main problem sits at the top, the subtasks it splits into sit underneath, and lines link each task to the parts it breaks into.
Reading the levels
You read a structure diagram downwards. Each lower box is a finer breakdown of the box above it, and the bottom row shows tasks that are small enough to tackle on their own. For example, organising a school fun run could be broken down like this:
| Level | What it shows |
|---|---|
| 1 | Organise the fun run |
| 2 | Register runners Plan the route Set up the finish line |
| 3 | Under “Register runners”: Collect entry forms Take payment Send confirmation |
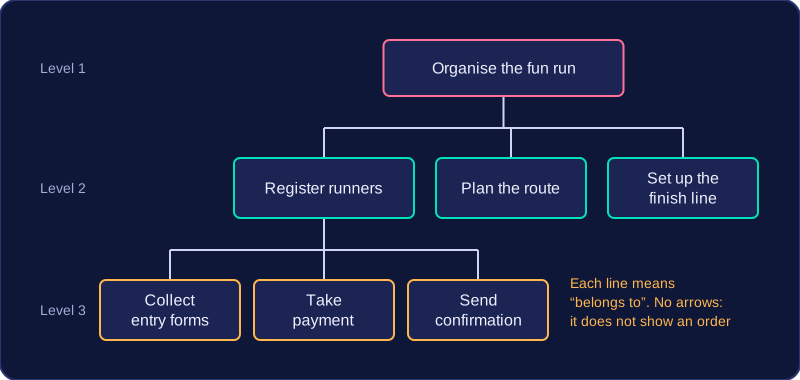
Each line is a “belongs to” link: the three level 2 tasks together make up the level 1 problem, and, under “Register runners”, the three level 3 tasks together make up that task. Read downwards to see a task broken into smaller tasks, and upwards to see which larger task a box belongs to.
Not a flowchart
A structure diagram is not a flowchart. A flowchart shows the step-by-step order in which processing happens, with arrows telling you what to do next. A structure diagram only shows the breakdown, so the lines say which larger task a subtask belongs to. Two boxes side by side are not “do this, then that” — they are simply two parts of the same job, and the diagram does not say which one you would do first.
Practise this
Edexcel GCSE Computer Science · Abstraction and Decomposition